
The Federal Reserve bailed out Wall Street financial firms (domestic and foreign) during the great financial crisis (2008-2010), to include: Morgan Stanley, Bank of America, Citibank, Goldman Sachs, JP Morgan, Merrill Lynch, AIG, State Street, UBS, BNP Paribas, Barclays, Deutsche Bank, Royal Bank of Scotland, and many others.
The Fed again stepped in to flush many of the same financial institutions with liquidity during the Covid crisis (2021-22).
It is now time to grand U.S. citizens the same direct access to liquidity that was so generously doled out to Wall Street.
It is now time to restore financial order in America: The Leviticus 25 Plan
_________________________________
Americans report strain from so reasing household debt
Total household debt increased to $18.59 trillion in the third quarter of 2025, or $990 billion below the all-time 2008 high of $19.57 trillion.
By Elyse Apel | The Center Square | Published: November 12, 2025
More than half of U.S. households say they’re struggling with debt, according to a new WalletHub survey.
Total household debt increased to $18.59 trillion in the third quarter of 2025, which is $990 billion below the all-time 2008 high of $19.57 trillion.
Still, debt is steadily rising for many, with more than two in five people expecting their household debt to increase in the next 12 months.
Chip Lupo, a writer and analyst for WalletHub, told The Center Square in an exclusive interview that the survey’s findings are very concerning.
“What stood out most to me about this survey is just how deeply Americans feel the weight of debt; not just financially, but emotionally and physically,” Lupo said. “More than half of households report struggling with debt; 36% feel ‘owned’ by credit card companies; and 38% say it affects their health. This combination of financial strain and personal stress is striking.”
The recently-released survey was done in conjunction with WalletHub’s Household Debt Report, which examined the latest economic data from the third quarter. Notably, the report found that the average American household had:
• $108,425 in mortgage debt
• $3,500 in home equity lines of credit debt
• $13,727 in auto loan debt
• $13,711 in student loan debt
• $10,227 in credit card debt
• $4,562 in other debt, which included personal loans and other financing
The survey sought to put these findings from the report in context. Across the nation, it found that American families are drowning in debt.
In total, 56% said their household is struggling with debt. Many don’t see an end in sight, with 46% anticipating they will still have debt when they die.
Credit card debt is causing the most strain for families, the survey found. In total, 46% of American households reported struggling with credit card debt the most, followed by mortgages at 23% and student loans at 13%.
Many pointed to high inflation and an ever-increasing cost of living as playing a role in their increasing debt.
“High inflation is seen as the primary driver of rising debt, and nearly half of Americans expect to carry debt to the grave,” Lupo said. “These figures highlight how critical it is for consumers to track their net worth and actively manage debt, especially credit card balances, as the survey shows that this is the most common source of financial stress.”
…………………………………………………………….
Where US Families Are Most Strained By Debt
ZeroHedge, Nov 01, 2025
Excerpt:
Americans are always worrying about debt: their own and their government’s.
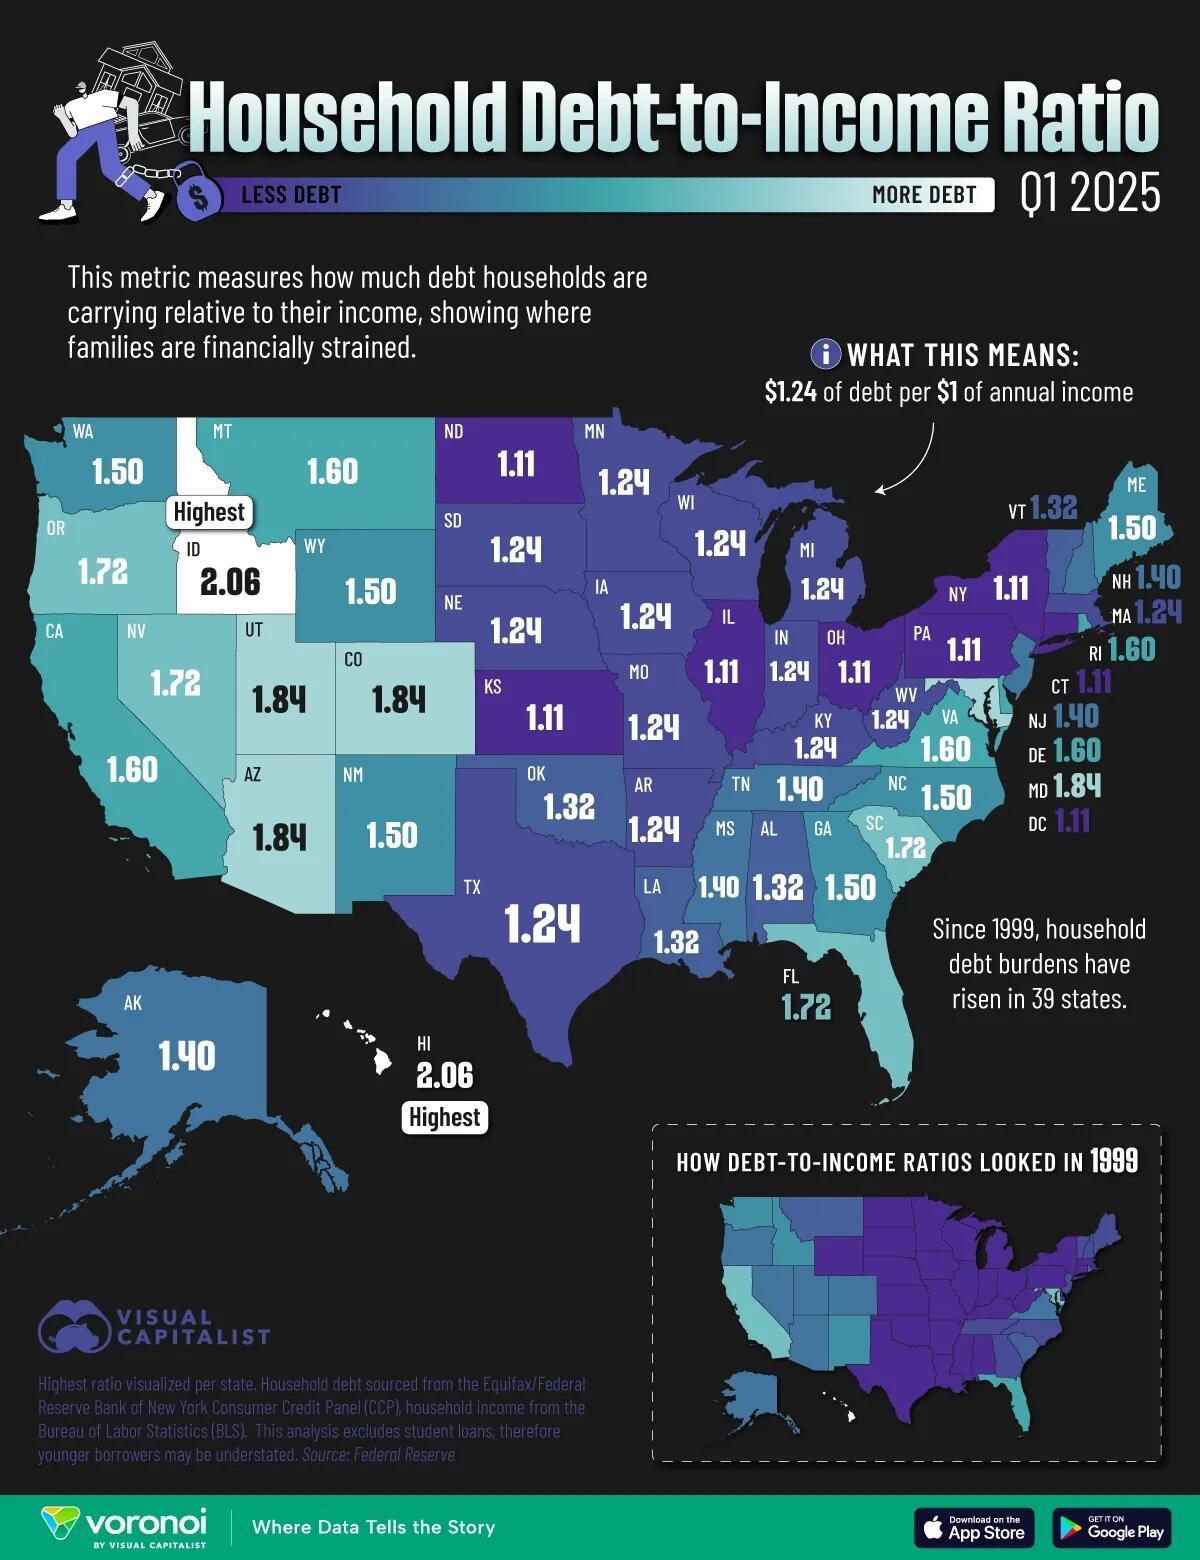
This visualization, via Visual Capitalist’s Pallavi Rao, maps each state by their household debt-to-income ratios (DTI) in Q1, 2025, revealing which states carry the heaviest burdens and which ones keep borrowing in check.
Data for this visualization comes from the Federal Reserve. The highest ratio is visualized per state.
ℹ️ Debt includes mortgages, autos, credit cards, etc., and excludes student loans. Income is based on unemployment insurance-covered wages, as reported to the Bureau of Labor Statistics.
Which States Carry the Most Debt?
Two states share the top spot: Idaho and Hawaii both post a DTI of 2.06, meaning households owe just over twice their annual after-tax income.
| Rank | State | State Code | Debt-to-Income Ratio (2025) | Debt-to-Income Ratio (1999) | 1999–2025 Change |
| 1 | Idaho | ID | 2.06 | 1.50 | 0.56 |
| 2 | Hawaii | HI | 2.06 | 2.06 | 0.00 |
| 3 | Arizona | AZ | 1.84 | 1.40 | 0.44 |
| 4 | Colorado | CO | 1.84 | 1.40 | 0.44 |
| 5 | Utah | UT | 1.84 | 1.40 | 0.44 |
| 6 | Maryland | MD | 1.84 | 1.72 | 0.12 |
| 7 | South Carolina | SC | 1.72 | 1.32 | 0.40 |
| 8 | Nevada | NV | 1.72 | 1.40 | 0.32 |
| 9 | Oregon | OR | 1.72 | 1.40 | 0.32 |
| 10 | Florida | FL | 1.72 | 1.60 | 0.12 |
| 11 | Delaware | DE | 1.60 | 1.11 | 0.49 |
| 12 | Montana | MT | 1.60 | 1.32 | 0.28 |
| 13 | Rhode Island | RI | 1.60 | 1.32 | 0.28 |
| 14 | Virginia | VA | 1.60 | 1.40 | 0.20 |
| 15 | California | CA | 1.60 | 1.72 | -0.12 |
| 16 | Wyoming | WY | 1.50 | 1.11 | 0.39 |
| 17 | Georgia | GA | 1.50 | 1.24 | 0.26 |
| 18 | Maine | ME | 1.50 | 1.24 | 0.26 |
| 19 | North Carolina | NC | 1.50 | 1.24 | 0.26 |
| 20 | New Mexico | NM | 1.50 | 1.50 | 0.00 |
| 21 | Washington | WA | 1.50 | 1.50 | 0.00 |
| 22 | Mississippi | MS | 1.40 | 1.11 | 0.29 |
| 23 | New Hampshire | NH | 1.40 | 1.24 | 0.16 |
| 24 | New Jersey | NJ | 1.40 | 1.24 | 0.16 |
| 25 | Tennessee | TN | 1.40 | 1.24 | 0.16 |
| 26 | Alaska | AK | 1.40 | 1.32 | 0.08 |
| 27 | Alabama | AL | 1.32 | 1.11 | 0.21 |
| 28 | Louisiana | LA | 1.32 | 1.11 | 0.21 |
| 29 | Oklahoma | OK | 1.32 | 1.11 | 0.21 |
| 30 | Vermont | VT | 1.32 | 1.24 | 0.08 |
| 31 | Arkansas | AR | 1.24 | 1.11 | 0.13 |
| 32 | Indiana | IN | 1.24 | 1.11 | 0.13 |
| 33 | Iowa | IA | 1.24 | 1.11 | 0.13 |
| 34 | Kentucky | KY | 1.24 | 1.11 | 0.13 |
| 35 | Massachusetts | MA | 1.24 | 1.11 | 0.13 |
| 36 | Michigan | MI | 1.24 | 1.11 | 0.13 |
| 37 | Minnesota | MN | 1.24 | 1.11 | 0.13 |
| 38 | Missouri | MO | 1.24 | 1.11 | 0.13 |
| 39 | Nebraska | NE | 1.24 | 1.11 | 0.13 |
| 40 | South Dakota | SD | 1.24 | 1.11 | 0.13 |
| 41 | Texas | TX | 1.24 | 1.11 | 0.13 |
| 42 | West Virginia | WV | 1.24 | 1.11 | 0.13 |
| 43 | Wisconsin | WI | 1.24 | 1.11 | 0.13 |
| 44 | Connecticut | CT | 1.11 | 1.11 | 0.00 |
| 45 | District of Columbia | DC | 1.11 | 1.11 | 0.00 |
| 46 | Illinois | IL | 1.11 | 1.11 | 0.00 |
| 47 | Kansas | KS | 1.11 | 1.11 | 0.00 |
| 48 | New York | NY | 1.11 | 1.11 | 0.00 |
| 49 | North Dakota | ND | 1.11 | 1.11 | 0.00 |
| 50 | Ohio | OH | 1.11 | 1.11 | 0.00 |
| 51 | Pennsylvania | PA | 1.11 | 1.11 | 0.00 |
…check out Visualizing Government Debt-to-GDP Around the World on Voronoi, the new app from Visual Capitalist.
___________________________________________
The Leviticus 25 Plan is the one and only comprehensive economic acceleration plan in the world with the raw power to eliminate massive tracts of family debt and restore self-reliance and financial security for millions of qualifying American families.
It is also the only plan that can restore financial order within the U.S. federal government and the state governments of all 51 states.
The Leviticus 25 Plan will also generate an average $36.568 billion in federal budget surpluses over each of the first five years of activation (2026-2030) – versus projected $2 trillion deficits.
The Leviticus 25 Plan – An Economic Acceleration Plan for America
$95,000 per U.S. citizen – Leviticus 25 Plan 2026 (40186 downloads )