
A Look back on America’s path to the current $18.8 trillion in Household Debt…
The Federal Reserve’s ‘secret liquidity lifelines’ for major banks 2008-2010:
Bloomberg LP filed a Freedom of Information Act (FOIA) lawsuit on Nov 7, 2008 to gain access to information regarding special emergency lending programs that the U.S. Federal Reserve had been running to help borrower banks deal with cash shortages and collateral deficiencies. The Fed fought the lawsuit, but ultimately lost.
Bloomberg gained access to more than 29,000 pages of previously secret loan documents and Fed spreadsheets, and published the highlights of those programs in late 2011.
According to Bloomberg, the top 15 recipients of Fed’s ‘secret liquidity lifelines’ were the very firms that in large part precipitated the great financial crisis with their subprime lending gambits and insufficient risk management strategies:
Morgan Stanley $107 billion
Citigroup Inc. $99.5 billion
Bank of America Corp $91.4 billion
Royal Bank of Scotland Plc $84.5 billion
State Street Corp $77.8 billion
UBS AG $77.2 billion
Goldman Sachs Group Inc. $69 billion
JP Morgan Chase & Co $68.6 billion
Deutsche Bank AG $66 billion
Barclays Plc $64.9 billion
Merrill Lynch & Co Inc. $62.1 billion
Credit Suisse Group AG $60.8 billion
Dexia SA $58.5 billion
Wachovia $50 billion
The Fed ‘flooded’ the financial coffers of these major U.S. and foreign banks (with U.S subsidiaries) with trillions of dollars in direct cash transfers, credit guarantees, and balance sheet transfers of (often ‘sewage grade’) agency debt and MBS – and the principles of those institutions ended up making out very well.
None of them took a haircut
Meanwhile, U.S citizens out in Main Street America did not fare so well… There were severe financial dislocations; 8.7 million Americans lost their jobs during the financial crisis years; 4.1 million American families lost their homes through completed foreclosures from September 2008 through December 2012, according to CoreLogic.
Tens of millions of American families remain financially oppressed in the aftermath of that crisis.
The time is now to rebalance the books in America…
…………………………………………
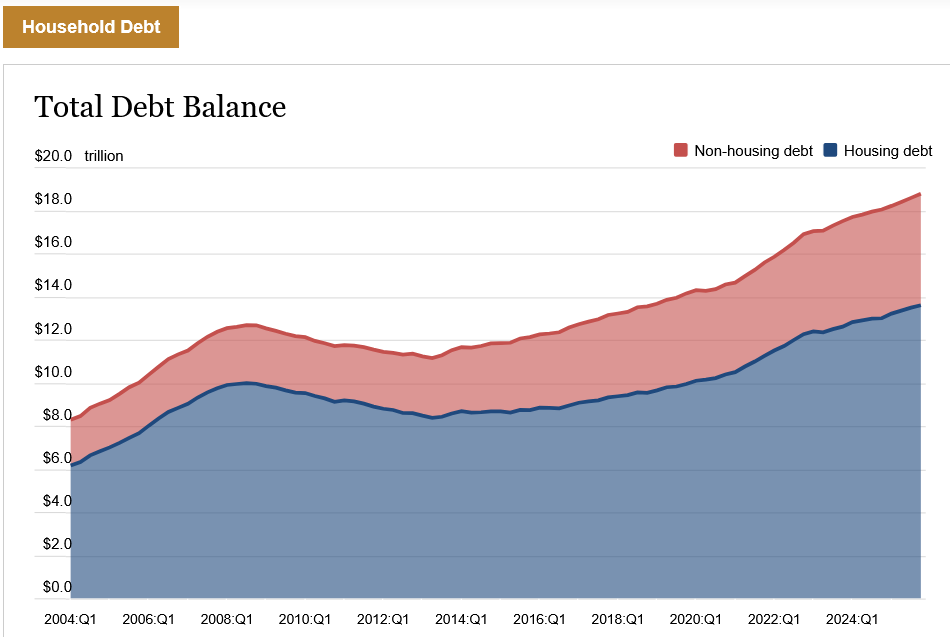
NY FED HOUSEHOLD DEBT AND CREDIT REPORT (Q4 2025)
Mortgage balances shown on consumer credit reports grew by $98 billion during the fourth quarter of 2025 and totaled $13.17 trillion at the end of December.
Balances on home equity lines of credit (HELOC) rose by $12 billion, the 15th consecutive quarterly increase. There is now $433 billion in outstanding HELOC balances, $116 billion above the low reached in 2022Q1.
In total, non-housing balances increased by $81 billion, a 1.6% increase from 2025Q3.
Credit card balances rose by $44 billion during the fourth quarter and now total $1.28 trillion outstanding, up 5.5% since last year.
Auto loan balances edged up by $12 billion to $1.66 trillion.
Other balances, which include retail cards and consumer finance loans, rose by $14 billion and now total $564 billion.
Student loan balances increased by $11 billion and now stand at $1.66 trillion.
…………………………………………
AI Overview – DSR
In late 2025, the total household debt service ratio (DSR) reached approximately 11.3% of disposable personal income. This metric reflects the share of after-tax income that U.S. households allocate to required debt payments, including mortgages and consumer loans.
Current Debt Service Landscape (Late 2025)
The Federal Reserve reported a steady increase in the debt burden throughout the year as total household debt reached a record $18.8 trillion by the end of Q4 2025.
- Total Debt Service Ratio (DSR): The ratio stood at 11.32% in the fourth quarter of 2025, up from 11.26% in Q3 and 11.12% in Q2.
- Mortgage Debt Service: Mortgage payments accounted for approximately 5.92% of disposable income in late 2025.
- Consumer Debt Service: Payments for non-mortgage debt (such as auto loans and credit cards) represented about 5.40% of disposable income.
- Historical Context: While the ratio has climbed since 2021, it remains below the 13.2% peak seen before the 2008 financial crisis and is roughly in line with the long-term average of approximately 11.2%–11.3%.
Key Drivers of the Increase
- Rising Interest Rates: Higher rates on variable-rate debts and new loans have increased the cost of carrying debt relative to income.
- Credit Card Balances: Credit card debt reached a record $1.28 trillion by late 2025, with balances growing as consumers managed higher costs of living.
- Delinquency Trends: The share of debt in some stage of delinquency rose to 4.8% in Q4 2025, up from 4.5% in the previous quarter, signaling growing financial pressure on some households.
……………………………………………….
Household Debt Statistics – Average Interest Rates
Average interest rates on U.S. household debt vary significantly by type, with credit card APRs averaging over 23%–28%, and new auto loans often over 6%–10%. Total household debt, including mortgages (around 7.18%), remains high, with many Americans struggling with rising payments.
Key Interest Rate Breakdown (as of 2025-2026):
- Credit Cards: Average APRs are roughly 23.7% to 28.6%, with many consumers paying over 22%.
- Mortgages: Average 30-year fixed rates are around 7.18%.
- Auto Loans: Average interest rates on new cars often exceed 10%.
- Student Loans: Federal undergraduate loan rates are lower, averaging around 4.99%.
Household Debt Trends:
- Rising Debt: Total credit card balances have risen to nearly trillion, with many households facing high-interest debt.
- Delinquencies: Serious delinquencies (90+ days) are increasing, particularly for credit cards and auto loans …
- Debt Service: Households are spending a growing portion of their income on debt payments, with the total debt service ratio at approximately of disposable income in late 2025.
Note: Interest rates are based on recent 2025-2026 data and can change frequently.
Source: NY Fed Feb 13, 2026
___________________________________
The Leviticus 25 Plan grants the same direct access to liquidity extensions that was so generously provided to major U.S. and foreign banks during the great financial crisis (2008-2010) – the very banks that precipitated the subprime loan-driven crisis.
The Leviticus 25 Plan will pave the way for the colossal economic reset and powerful debt elimination plan that America needs to survive.
The Leviticus 25 Plan will generate $37.303 billion annual federal budget surpluses (2027-2031) along with overwhelmingly favorable budget rebalancing dynamics for state and local governments.
The Leviticus 25 Plan will also pay down, or pay off, trillions of dollars in U.S. Household Debt for all who qualify, and thereby eliminate substantial proportions of Mortgage Debt ($13.17 trillion), HELOC ($433 billion), Auto Loan Balances ($12 billion), Retail Cards / Consumer Finance Loans ($564 billion), Student Loan Balances ($1.66 trillion), Credit Card Balances ($1.28 trillion) and $120 annually in Credit Card Interest and Fees.
The Leviticus 25 Plan is a dynamic economic initiative providing direct liquidity benefits for American families, while at the same time scaling back the role of government in managing and controlling the affairs of citizens. It is a comprehensive plan with long-term economic and social benefits for citizens and government.
The inspiration for this plan is based upon Biblical principles set forth in the Book of Leviticus, principles tendering direct economic liberties to the people.
The Leviticus 25 Plan – An Economic Acceleration Plan for America
$95,000 par U.S. citizen – Leviticus 25 Plan 2027 (48710 downloads )