
M2 is the Fed’s estimate of the U.S. total money supply.
M2 is a measure of the U.S. money stock that includes M1 (currency and coins held by the non-bank public, checkable deposits, and travelers’ checks) plus savings deposits (including money market deposit accounts), small time deposits under $100,000, and shares in retail money market mutual funds. (Source: St. Louis Fed)
Central banks can influence M2 supply by either issuing more money into the economy or by incentivising people to spend less. Quantitative easing is one way that a central bank can increase money supply and stimulate the economy. (Source: IG.com)
………………..
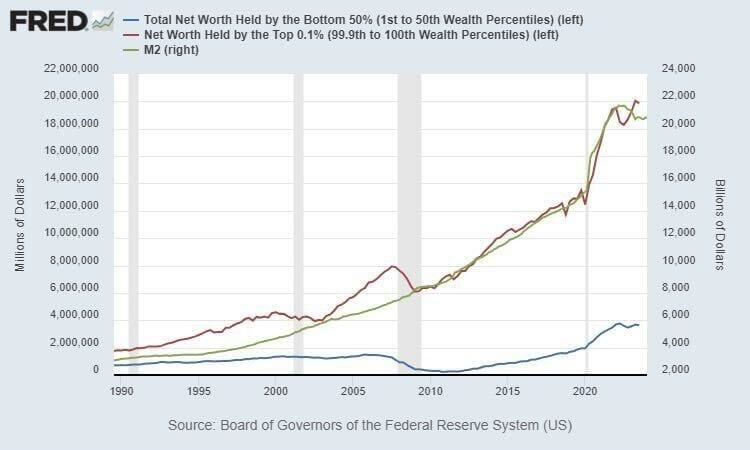
Total Net Worth held by the Top 0.1% (red) and the Bottom 50% (blue), and M2 (green), were all relatively stable, showing a modest upside trajectory, through about 1995. At that time the (red vs blue) gap was approximately $2 trillion.
But then as the Fed began ratcheting up M2 (2000-2020), the gap between the Top 0.1% and the Bottom 50% began to reveal a significant distortion.
And then when the Fed began ‘goosing’ M2 in serious fashion (2020-2022), the gap became especially pronounced – widening out to approximately $16 trillion by 2022.
Clearly, Fed monetary interventions favored the ultra-wealthy participants in the U.S. economy.
US M2 Money Supply is at a current level of 20.79T, down from 20.86T last month and down from 21.12T one year ago. This is a change of -0.36% from last month and -1.58% from one year ago. (Source: YCharts.com)
“Recent inflation behavior has been consistent with a lagged effect of M2 on personal consumption expenditures (PCE) inflation,” Neely wrote. For instance, he cited the rise of PCE inflation beginning in February 2021, which coincided with the peak M2 growth rate of 26.9% and was a year after M2 growth began to soar. (Source: St. Louis Fed, Oct 17, 2023)
___________________________
The Top 0.1% benefactors of the Fed policies pumping M2 higher would be concentrated, directly or indirectly, within the very financial sectors which precipitated the 2008-2010 Great Financial Crisis, fell below their capital requirements, and then magically went on to receive: 1) Federal Reserve Discount Window access; and 2) “Secret Liquidity Lifeline” credit extensions pumped through funding facilities created by the Federal reserve (Term Auction Facility (TAF), Commercial Paper Funding Facility (CPFF), Primary Dealer Credit Facility (PDCF), the Term Securities Lending Facility (TSLF), Single-Tranche Open Market Operations (ST OMO), the Asset-Backed Commercial Paper Money Market Mutual Funding Liquidity Facility (AMLF) and several other credit facilities).
Who were these benefactors specifically? Primarily the officers and principles of major Wall Street banks and insurers, and the major shareholders in those institutions (e.g., Warren Buffett – Wells Fargo, Goldman Sachs).
It is now time to balance the scales and grant that same direct access to Fed liquidity extensions to America’s hard-working, tax-paying U.S. citizens.
It is high time to get America back on track: 1) Balanced budgets; 2) Legitimate, non-debt based, economic growth; 3) Restored financial security for millions of American families; and 4) Economic Liberty.
_______________________________
The Leviticus 25 Plan – An Economic Acceleration Plan for America
$90,000 per U.S. citizen – Leviticus 25 Plan 2025 (12553 downloads )