
Loaded up and ready to launch.
The Leviticus 25 Plan 2027 – the most powerful economic acceleration plan in the world. Updated economic scoring summary: Every qualifying U.S. citizen who wishes to participate will receive $60,000 (Family Account) and $35,000 (Medical Savings Account). $95,000 per U.S. citizen. Massive public and private debt elimination. Economic liberty

Economic Scoring Subtotals:
CBO projected deficit summary (2027-2031):$9.909 trillion
Recapture gains (2027-2031):
Federal Income Tax recapture benefit: $1.366 trillion
Safety Net Program recapture benefit: $3.224 trillion
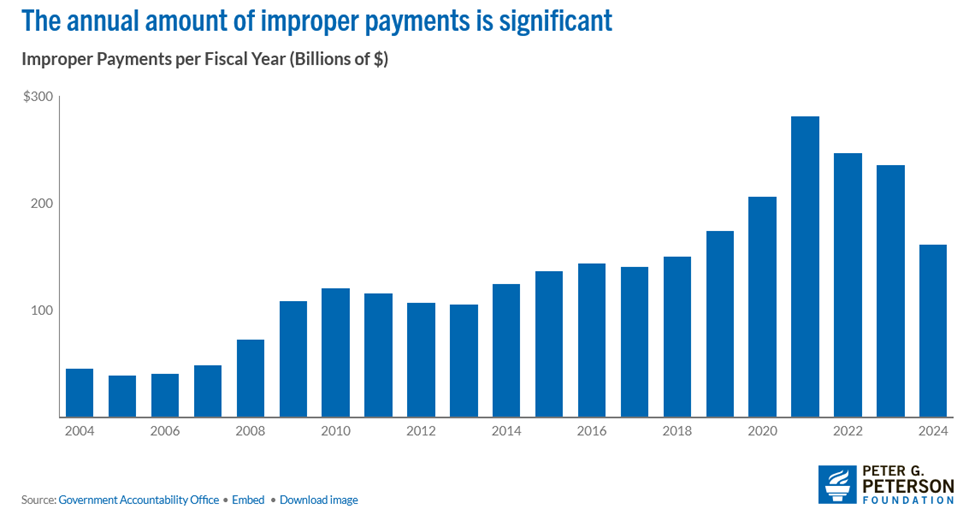
Medicaid/CHIP $7,000 deductible recapture $2.335 trillion
Medicare $7,000 deductible recapture:$2.152 trillion
VA $7,000 deductible recapture:$257.6 billion
TRICARE $7,000 deductible recapture: $263.2 billion
FEHB $7,000 deductible recapture: $229.6 billion
SSDI recapture:$658.7 billion
Subtotal Summary – Recapture:$10.486 trillion
Net surplus subtotal (before interest savings): $10.486 trillion – $9.909 trillion = $57.7 billion
____________________________________
The Leviticus 25 Plan budget surplus
Totals – 2027-2031:
5-year projected deficit (CBO): $9.909 trillion
5-year projected recapture (subtotal): $10.486 trillion
5-year projected interest expense savings: $128.817 billion
Budget surplus (projected) 2027-2031 – before interest expense savings:
$10.486 trillion – $9.909 trillion = $57.7 billion
Budget surplus (projected) 2027-2031 – including interest expense savings:
$57.7 billion + $128.817 billion = $186.517 billion
Average annual budget surplus (projected) 2027-2031:
$186.517 billion / 5 years: $37.303 billion per year
Note 1: Projected budget surpluses for 2027-2031 do not factor in the additional government tax revenue gains that would accrue from the massive shift in capital away from debt service and into
productive economic activity.
Note 2: Projected budget surpluses for 2027-2031 do not factor in the additional government tax revenue gains that would accrue from significantly lower levels of debt deductibility on individual income tax filings.
Note 3: Projected budget surpluses from the Medicaid / CHIP recapture do not take into account the likelihood of fewer citizens actually qualifying for Medicaid / CHIP benefits.
Note 4: Projected budget surpluses from Interest Expense Reductions during each of the first five years of activation (2027-2031) is likely understated due to the fact that ‘debt held by the public’ is projected to increase by 8.5% per year, from $28.278 trillion in 2026 to $40.198 trillion in 2030.
Note 5: The Plan’s funding of individual Medical Savings Accounts (MSAs) with the $7,000 deductible provision per year would result in an enormous drop in the number of claims each year for Medicare reimbursement. Medicare payroll taxes would generate a growing revenue stream, due to stronger economic growth, while outlays would drop significantly from the reduced claims numbers – thereby providing the Fed / Treasury Department with a powerful recapitalization of the Medicare Trust Fund, via the Citizen’s Credit Facility.
The Leviticus 25 Plan – Projection limitations
There can be no question that The Leviticus 25 Plan would generate healthy, broad-based economic growth from broad-based debt reduction and improved financial stability at the family level, the restoration of free market dynamics in commerce, and scaling back social program work disincentives.
The Leviticus 25 Plan does not attempt to project how much additional tax revenue and reduced cost of government will be realized, above and beyond the Recapture Provisions, over the course of the initial five years of the plan. In that sense, The Plan understates the effect of additional dynamic economic benefits.
Robust funding of Medical Savings Accounts and the elimination of millions of insurance claims and claims resolutions for basic primary care and everyday healthcare purchases swill save millions of man-hours of health care cost on an annual basis. Scaling back government involvement in basic primary care and everyday healthcare purchases for millions of Americans will also generate massive cost savings.
The Plan makes no attempt to project the positive effects of the streamlined, consumer-driven efficiencies that will emerge, and the cost reduction and improvement in services.
The Plan therefore understates the benefits.
The Plan projects an 80 percent participation rate by U.S. citizens. It is assumed that a large number of wealthy Americans will not participate, because their tax refunds are larger than the annual Plan benefits. And it is assumed that a large number of Americans receiving significant government benefits for extraordinary health or economic issues will also not participate.
Cost savings from the reductions in massive social welfare spending and other programs, like unemployment insurance, workman’s compensation, SSI and SSDI can be difficult to quantity, since state and federal funding mechanisms may both be involved in various ways. In that regard, The Plan may understate, or it may overstate, the benefits.
…………………..
Scoring Analysis – Jan 2026:
………………………………………………….
The Leviticus 25 Plan is a dynamic economic initiative providing direct liquidity benefits for American families, while at the same time scaling back the role of government in managing and controlling the affairs of citizens. It is a comprehensive plan with long-term economic and social benefits for citizens and government.
The inspiration for this plan is based upon Biblical principles set forth in the Book of Leviticus, principles tendering direct economic liberties to the people.
The Leviticus 25 Plan – An Economic Acceleration Plan for America
$95,000 per U.S. citizen – Leviticus 25 Plan 2027 (45296 downloads )


