2024: Global Debt – $102 Trillion

The U.S. could lead the world’s economies out of this massive debt quagmire – with the right powerful, new ‘targeted liquidity’ economic acceleration strategy: The Leviticus 25 Plan.

“He who will not apply new remedies must expect new evils.” – Sir Francis Bacon

………………………………………………………………………..

Visualizing $102 Trillion Of Global Debt In 2024– | ZeroHedge, Dec 22, 2024

In 2024, global public debt is forecast to reach $102 trillion, with the U.S. and China largely contributing to rising levels of debt.

This marks a $5 trillion increase since 2023 alone. Looking ahead, debt levels are projected to increase faster than previously expected as government policies fail to address debt risks amid aging populations and increasing healthcare costs. Going further, rising geopolitical tensions could lead to higher spending on defense, adding strain to government budgets.

This graphic, via Visual Capitalist’s Dorothy Neufeld, shows government debt by country in 2024, based on data from the IMF’s October 2024 World Economic Outlook.

Ranked: Government Debt by Country

As the world’s largest economy, the U.S. debt pile continues to balloon, accounting for 34.6% of the world’s total government debt.

Overall, net interest payments on the national debt soared to $892 billion in the 2024 fiscal year. By 2034, these costs are forecast to reach $1.7 trillion, with total net interest costs amounting to $12.9 trillion over the next decade. A rising mountain of debt and higher interest rates are among the primary factors driving up net interest costs.

[Here] we show the gross government debt of 186 countries worldwide in 2024.

*The above table uses IMF data from October 2024, however, the most current up-to-date number for U.S. government debt is $36.1 trillion based on data from the U.S. Treasury for December 12, 2024.

China, ranking second globally, holds 16.1% of the world’s government debt.

Over the next five years, China’s debt to GDP ratio is projected to hit 111.1% of GDP, up from 90.1% in 2024. Going further, Chinese officials recently stated they are prepared to deploy stimulus measures to support the economy if Trump imposes sweeping tariffs on goods imported from China. As a result, China’s debt to GDP could rise even faster than current projections.

India, ranked seventh globally, has amassed $3.2 trillion in debt, an increase of 74% since 2019. However, thanks to its strong economic growth and fiscal policies that are increasing government revenues, debt as a percentage of GDP is projected to fall gradually from 83.1% in 2024 to 80.5% by 2028.

In Europe, the UK has amassed the most debt, about $3.65 trillion, equal to 101.8% of GDP. This is far higher than the regional average, standing at 77.4% of GDP in 2024. Europe has a lower debt to GDP than North America and the Asia-Pacific, but European budgets likely face increasing pressures looking ahead, due to sluggish economic growth, trade wars, and aging populations.

A Regional Outlook for Global Debt

Below, we show how government debt by region is projected to change over the next five years:

As we can see, average debt by country in North America is set to swell to 125% of GDP, the highest across global regions.

With governments increasingly using stimulus measures to boost the economy, it poses a greater threat to fiscal sustainability. In order to stabilize debts, the IMF stated that major spending cuts and tax hikes are needed over the next five to seven years.

Like North America, debt to GDP ratios are set to increase across Asia, Europe, and the Middle East.

Overall, world government debt is projected to exceed 100% of global output by 2029, driven by several large countries including the U.S., China, Brazil, and France, among others.

To learn more about this topic from a forward-looking perspective, check out this graphic on G7 government debt projections over the next five years.

____________________________________________

The world’s one and only government and private sector ‘debt-slaying colossus:’

The Leviticus 25 Plan is a dynamic economic initiative providing direct liquidity benefits for American families, while at the same time scaling back the role of government in managing and controlling the affairs of citizens.  It is a comprehensive plan with long-term economic and social benefits for citizens and government.

The inspiration for this plan is based upon Biblical principles set forth in the Book of Leviticus, principles tendering direct economic liberties to the people.

The Leviticus 25 Plan – An Economic Acceleration Plan for America

$90,000 per U.S. citizen – Leviticus 25 Plan 2026 (24647 downloads )

A Major Quality of Life Upgrade for the United States: The Leviticus 25 Plan 2026

America is long overdue for a comprehensive ‘quality of life’ upgrade – one that starts with restoring economic liberty and securing financial health for families all across our land. A primary benefit of this plan must be to ‘de-stress’ American families and allow parents more quality time with their children, restored financial security, and a more manageable pace of life.

America needs a tour de force plan with the creative power to generate massive new tax revenue flows, reduce government expenditures, and eliminate government deficits – a plan that will set America, and the U.S. Dollar, on a path of long-term financial stability.

America’s upgrade must relight the fires of free market, citizen-driven economics and activate a citizen-centered health care system.

This plan must have the raw power to eliminate massive tracts of debt across all sectors of the economy, thereby allowing Federal Reserve ‘rate normalization’ measures, long-term net interest margin benefits for banks, insurers, pension funds.

There is one plan in America with the creative power to deliver these benefits.

The Leviticus 25 Plan is a dynamic economic initiative providing direct liquidity benefits for American families, while at the same time scaling back the role of government in managing and controlling the affairs of citizens.  It is a comprehensive plan with long-term economic and social benefits for citizens and government.

The inspiration for this plan is based upon Biblical principles set forth in the Book of Leviticus, principles tendering direct economic liberties to the people.

The Leviticus 25 Plan – An Economic Acceleration Plan for America

$90,000 per U.S. citizen – Leviticus 25 Plan 2026 (24590 downloads )

A Financial Reset for America: The Leviticus 25 Plan’s Societal Benefits – Incalculable

“It is true that the virtues which are less esteemed and practiced now – independence, self-reliance, and the willingness to bear risks, the readiness to back one’s own conviction against a majority, and the willingness to voluntary cooperation with one’s neighbors – are essentially those on which the of an individualist society rests. Collectivism has nothing to put in their place, and in so far as it already has destroyed then it has left a void filled by nothing but the demand for obedience and the compulsion of the individual to what is collectively decided to be good.”   Friedrich Hayek, The Road to Serfdom

……………………………………………………………..

The Leviticus 25 Plan re-establishes family and societal virtues which have been eroded through government encroachment and socialist-driven central planning – in America and elsewhere around the world.

The Leviticus 25 Plan – grants direct liquidity access to American families – the very same access to liquidity which was provided to the likes of Morgan Stanley, Citigroup, Bank of America Corp, Goldman Sachs, JP Morgan Chase, Merrill Lynch, Wells Fargo, Deutsch Bank, UBS AG, Royal Bank of Scotland, Plc, State Street, Barclays, and many, many others.

The primary goal of The Plan is debt elimination and the restoration of financial health and economic liberty for American families.

Imagine a family of four paying off their mortgage, car loans, credit card debt – and having additional on-hand liquidity for direct allocation for routine medical expenses.

The financial security benefits of all qualifying American families would be incalculable:

* Financial stress relief – quality of life improvements – general living conditions, nutrition.

* Working mothers desiring to spend more time with their children would be able scale back their outside employment hours or become full-time stay-at-home mothers.

* Financial self-reliance at family level – reduced dependence on social welfare and charity programs.

* Re-establishment of normal, positive incentives for work, enterprise, innovation, achievements.

* Improved credit status for working Americans

* Improved access to primary health care

* Improved employment opportunities.

* Significant potential for crime reduction.

……………………………………………………………………………….

There is no government-directed economic strategy that can provide even a fraction of these benefits.

The Leviticus 25 Plan is a dynamic economic initiative providing direct liquidity benefits for American families, while at the same time scaling back the role of government in managing and controlling the affairs of citizens.  It is a comprehensive plan with long-term economic and social benefits for citizens and government.

The inspiration for this plan is based upon Biblical principles set forth in the Book of Leviticus, principles tendering direct economic liberties to the people.

The Leviticus 25 Plan – An Economic Acceleration Plan for America

$90,000 per U.S. citizen – Leviticus 25 Plan 2026 (24590 downloads )

“Soaring Debt” and the fatalistic view that “nothing can prevent the inevitable US implosion.”

The Leviticus 25 Plan has the raw power to quench such fatalistic views — effecting massive reductions in government outlays and generating enormous, ongoing tax revenue inflows. to bring about dynamic federal, state, and local budget surpluses. 

The Leviticus 25 Plan will generate average annual budget surpluses of $36.568 billion for each of the first five years of activation (2026-2030) — vs current CBO-projected average annual deficits of $1.938 trillion.

This represents a monumental $2.304 trillion positive budget gain annually (2026-2030) for the U.S. federal budget, with major gains falling into line, also, for state and local government entities.

__________________________________ 

Scoring Update Summary:

*  The Leviticus 25 Plan 2026 Generates $36.568 Billion Federal Budget Surpluses Annually (2026-2030). Part 1: Overview, Deficit Projections (CBO)

*  The Leviticus 25 Plan Generates $36.568 Billion Federal Budget Surpluses Annually (2026-2030). Part 2: Federal Income Tax Recapture; Economic Security / Means-Tested Welfare Recapture.

*  The Leviticus 25 Plan Generates $36.568 Billion Federal Budget Surpluses Annually (2026-2030). Part 3: Medicaid, Medicare, VA, TRICARE, FEHB, SSDI Recapture

The Leviticus 25 Plan Generates $36.568 Billion Federal Budget Surpluses Annually (2026-2030). Part 4: Interest Expense Recapture

The Leviticus 25 Plan Generates $36.568 Billion Federal Budget Surpluses Annually (2026-2030). Part 5: Current Economic Scoring – Summary Totals

___________________________________  

Note 1:  Projected budget surpluses for 2026-2030 do not factor in the additional government tax revenue gains that would accrue from the massive shift in capital away from debt service and into productive economic activity.

Note 2:  Projected budget surpluses for 2026-2030 do not factor in the additional government tax revenue gains that would accrue from significantly lower levels of debt deductibility on individual income tax filings. 

Note 3:  Projected budget surpluses from the Medicaid / CHIP recapture do not take into account the likelihood of fewer citizens actually qualifying for Medicaid / CHIP benefits.

Note 4:  Projected budget surpluses from Interest Expense Reductions during each of the first five years of activation (2026-2030) is likely understated due to the fact that ‘debt held by the public’ is projected to increase by 8.5% per year, from $28.278 trillion in 2026 to $40.198 trillion in 2030.

Note 5The Plan’s funding of individual Medical Savings Accounts (MSAs) with the $6,000 deductible provision per year would result in an enormous drop in the number of claims each year for Medicare reimbursement. Medicare payroll taxes would generate a growing revenue stream, due to stronger economic growth, while outlays would drop significantly from the reduced claims numbers – thereby providing the Fed with a powerful tool to recapitalize the Medicare Trust Fund, vis the Citizen’s Credit Facility.

……………………………………….

CBO Projects US Debt To Soar By $24 Trillion Over Next Decade, And Then It Gets Much Worse…

ZeroHedge, Jan 17, 2025 – Excerpts:

….According to the latest CBO budget and economic outlook for the decade 2025 to 2035 the situation is hopeless and getting worse, and even though the budget office doesn’t use those actual terms, it does get pretty close.

While the economic picture presented by the CBO is hardly shocking, if as ridiculous as always, with zero recessions expected over the coming decade when the CBO projects GDP growing at a 1.8% annual pace, with inflation magically flat at 2.0%, unemployment rate a sticky 4.4% and a 3.2% fed funds rate (translating into 3.8% 10Y yield)…

it gets more exciting when looking at how all this growth is going to be funded. And the answer, of course, is through trillions more in unsustainable deficits, although according to the CBO these are perhaps sustainable since they never seem to end.

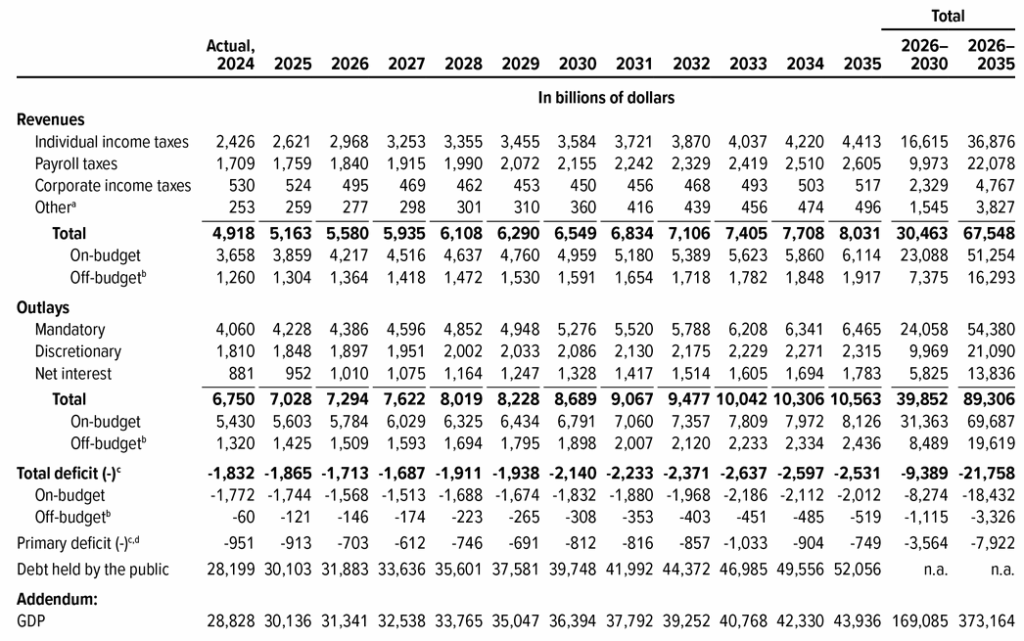
So starting with the deficit projection, the CBO expects a 2025 federal deficit of $1.9 trillion, a number which grows to $2.7 trillion by 2035. And while it amounts to 6.2% of GDP in 2025, and then drops to 5.2% by 2027 as revenues increase faster than outlays, this modestly beneficial trend quickly reverses and in later years, outlays once again increase faster than revenues, and by 2035, the deficit once again equals 6.1% of GDP, a number which according to the CBO is “significantly more than the 3.8 percent that deficits have averaged over the past 50 years.” It goes without saying that the actual deficit number will be far, far greater because even a modest recession will assure a surge in government spending (i.e., much more debt-funded deficit) which however will not result in faster growth.

It gets better. In an attempt to entrap Trump, who will very [likely] extend the expiring TCJA, or Trump tax cuts, the CBO amusingly enough cuts its long-term deficit forecast by $1 billion, but not because of higher growth or anything like that, but because it forecasts “increases in projected revenues from individual income taxes” even as “legislative changes and technical (that is, neither economic nor legislative) changes boosted projected deficits.” As a result, the cumulative deficit from 2025-2034 is expected to decline by $1 trillion, from $22.1 trillion to $21.1 trillion.

That way, in one year when the Trump tax cuts are extended, the CBO will throw the book at trump and blame him when it once again revises its deficit forecast dramatically higher.

As for the real reason why the US deficit is about to go exponential has little to do with taxes, and everything to do with the stratospheric levels of US debt, or rather interest on that debt, we find that while things are more or less normal for the next 3 years, then they go vertical, to wit:

“Federal outlays in 2025 total $7.0 trillion, or 23.3 percent of GDP. They remain close to that level through 2028 and then rise, reaching 24.4 percent of GDP in 2035 (if adjusted to exclude the effects of shifts in the timing of certain payments). The main reasons for that increase are growth in spending for Social Security and Medicare and rising net interest costs.”

Unfortunately, there is no such hockeystick effect to US government revenues which total $5.2 trillion, or 17.1% of GDP, in 2025, then rise to 18.2% of GDP by 2027, which according to the CBO is “because of the scheduled expiration of provisions of the 2017 tax act”, which obviously will not expire and instead will be extended, meaning revenues will not increase and while the CBO knows this, it will instead wait for 6-12 months before letting the hammer fall in its next, far uglier forecast.

But even without the 2017 tax act, the CBO projects that revenues as a share of GDP will then decline over the next two years, falling to 17.9% in 2029, and flatline around 18.3% in 2035. In reality, this number will be far lower, perhaps around 15% if note worse, due to the extension of the Trump tax cuts which means that the next CBO forecast will be substantially worse than the current one.

Alas, this one is also a disaster, and one has to look no further than the CBO’s debt forecast to see that. That’s because while debt held by the public (which conveniently excludes debt used to fund Social Security), is currently at $28.2 trillion, this number nearly doubles by 2035, when it is expected to hit $52.1 trillion.

But wait, wouldn’t debt only increase as GDP also increased, with the relative ratio improving? Actually no, because as the infamous CBO “chart of doom” shows, as debt held by the public rises each year, it does so at a faster pace than GDP; in fact, from 2025 to 2035, debt/GDP swells from 100% to 118%, an amount which as the CBO admits, is “greater than at any point in the nation’s history.”

Now the reason why the CBO published a report that saw a modest improvement in the US fiscal picture over the next decade is not because the US fiscal picture is actually improving, but on the contrary, was to entrap Trump and republicans. As ABC notes, “the analysis paints a difficult picture for an incoming Republican administration bent on cutting taxes in ways that further widen deficits unless they’re also paired with major spending cuts.” Indeed, Trump’s proposed extension of his 2017 tax cuts that are set to expire after this year along with new cuts could easily exceed $4 trillion and his nominee to be treasury secretary, Scott Bessent, warned Thursday that the economy could crash without them.

“We do not have a revenue problem in the U.S.,” Bessent insisted at his confirmation hearings. “We have a spending problem.”

He’s right, but the even bigger problem is that cutting any spending, whether discretionary or mandatory, would lead to unprecedented economic devastation for a country that is used to issuing debt and spending it like a drunken sailor.

While tax revenues as a share of the total U.S. economy are close to the 50-year average, government spending is poised to continue growing, largely because of the unprecedented $1.2 trillion in gross interest expense, a number that will almost certainly never go down again, because even if interest rates do drop briefly, the total amount of debt will just keep rising, more than offsetting any rate decline. Meanwhile, discretionary spending on national security and social programs will account for $1.85 trillion next year. The CBO already has spending in these categories on a downward trajectory as discretionary spending would equal 5.3% of GDP, down from the half-century average of 7.9%.

CBO Director Phillip Swagel told reporters at a press conference Friday that net interest costs are a major contributor to the deficit and “in the coming years, net interest costs are projected to be similar to the amounts of discretionary spending for either defense or non-defense” programs.

And all of that is, of course assuming no recession and a demographic picture that remains unchanged; alas both assumptions are ludicrous….

Unfortunately for the US, it is now way too late to change the inevitable outcome of an existence that has been driven by exorbitant debt-funded spending. Indeed, when it comes to normalizing or “doing no fiscal harm” that ship has sailed, and as much as we would like for there to be some happy ending, we are terrified at what will happen when the brightest minds in the room admit that the Department of Government Efficiency (DOGE) has been a failure, and that nothing can prevent the inevitable US implosion.

More in the full CBO bidget forecast.

__________________________________

The Leviticus 25 Plan – the most powerful economic acceleration plan in the world.

…………………………………….

“He who will not apply new remedies must expect new evils.” – Sir Francis Bacon

The Leviticus 25 Plan is a dynamic economic initiative providing direct liquidity benefits for American families, while at the same time scaling back the role of government in managing and controlling the affairs of citizens.  It is a comprehensive plan with long-term economic and social benefits for citizens and government.

The inspiration for this plan is based upon Biblical principles set forth in the Book of Leviticus, principles tendering direct economic liberties to the people.

The Leviticus 25 Plan – An Economic Acceleration Plan for America

$90,000 per U.S. citizen – Leviticus 25 Plan 2026 (24516 downloads )

The Leviticus 25 Plan 2026 Generates $36.568 Billion Federal Budget Surpluses Annually (2026-2030). Part 1: Overview, Deficit Projections (CBO)

The Leviticus 25 Plan – the most powerful economic acceleration plan in the world: Annual economic scoring update. For each of the first five years of activation (2026-2030), The Leviticus 25 Plan will generate average annual budget surpluses of $36.568 billion vs current CBO-projected average annual deficits of $1.983 trillion for the same period, representing a positive budget gain $2.109 trillion annually for the period.

______________________________

Overview, Primary Assumptions, Economic Scoring

The Leviticus 25 Plan activation period is slated for the 5-year period beginning in 2026 and ending in 2030

1.  The Leviticus 25 Plan – Each participating U.S. citizen will receive a $60,000 deposit into a Family Account (FA) and a $30,000 deposit into a Medical Savings Account (MSA).

All U.S. citizens residing in the United States are eligible to participate, contingent upon meeting qualification standards and agreement to specified recapture provisions. 

Participants (other than ‘custody account’ applicants) must prove stable credit history, stable job history, no recent drug/felony convictions.

These general recapture provisions include:

* Waiving all federal income tax refunds for a period of 5 years.

* Waiving benefits from economic security programs, select benefits from means-tested welfare programs, SSI, and SSDI for a period of 5 years.

* Enrollees in the Medicare, VA Healthcare system, Federal Employees Health Benefits     (FEHB), and TRICARE will be subject to a $6,000 deductible for primary care and outpatient services annually for a period of 5 years.  (See full plan for more details)

Primary scoring assumptions:

The Plan assumes an 80% participation rate by U.S. citizens. Wealthier Americans would choose not to participate, due to the comparative benefit of income tax refund amounts.  Many individuals of lower socio-economic sector would also choose not to participate, due to the comparatively high benefits profiles that they would not wish to give up.

The Plan assumes that participating families would use significant funds to pay down / eliminate debt, and that these longer-term, lower debt service obligations would enhance the financial security of participating families for several decades beyond the opening activation period.  Federal, state, and local government entities would benefit from longer-term tax revenue growth and reduced citizen dependence on government-based entitlement program benefits.

The Plan assumes that dynamic new efficiencies would emerge in the healthcare system – with more families managing/directing healthcare expenditures through their MSAs.

The Plan assumes that apart from the recapture provisions, there would also be significant tax revenue growth for federal, state and local government entities from free-market economic revitalization, more people working and paying taxes, and from the elimination of various income tax deductions (e.g. mortgage / HELOC interest expense).

The Plan assumes that there would not be a massive full-scale move back into the means-tested welfare programs, income security programs, SSI, and SSDI at the end of the initial 5-year activation period. 

The benefits of a free-market economy and newfound economic liberty for American families would provide positive economic inertia throughout years 5-10, and for several decades beyond.

Recapture provisions would provide a substantial federal budget surpluses for each year of the initial 5-year period. Economic growth over the following 10-15 years would generate sufficient recapture funding and tax revenue growth to offset the entire initial Federal Reserve balance sheet expansion.

Significant inertia from The Plan would also provide on-going, market-based growth benefits over succeeding years that far exceed any prospect for healthy economic growth that may be expected under America’s current big-government, central-planning approach.

Dynamic economic benefits would flow from:

* Family level massive debt elimination, financial security gains.

* Timely, sweeping reversal of big government “central planning” control.

* Productivity gains from reversal of work disincentives currently embedded in social programs.

* Economic growth, improved productivity, job creation, free market dynamics.

* Stabilization of bank capitalization, housing market.

* Strengthen / stabilize long-term value of U.S. Dollar.

* Minimizing the role of government in managing, directing, controlling the affairs of citizens.

2.  Federal Budget Deficit Projections – Congressional Budget Office

The Budget and Economic Outlook: 2024-2034 projects budget deficits ranging from $1.938 trillion 2025 to $2.193 in 2030, and on up to $2.862 trillion by 2034. Actual deficits for the out years are likely to be higher than CBO projections, based upon history (“actual” versus “projected”).

Congressional Budget Office (CBO) Deficit Projections 2024-2034

CBO deficit projections for target period (2026-2030)

2024: $1.915 trillion (actual) vs $1.571 trillion (projected)

2025:  $1.938 trillion

2026:  $1.851 trillion

2027:  $1.756 trillion

2028:  $1.942 trillion

2029:  $1.949 trillion

2030:  $2.193 trillion

Total deficits projected 2026-2030:  $9.691 trillion

Source: CBO 10-Year Budget Projections (2024-2034):  https://www.cbo.gov/publication/60419

___________________________________

The Leviticus 25 Plan Generates $36.568 Billion Federal Budget Surpluses Annually (2026-2030). Part 2: Federal Income Tax Recapture; Economic Security / Means-Tested Welfare Recapture.

The Leviticus 25 Plan – the most powerful economic acceleration plan in the world: economic scoring summary.

____________________________

Federal Income Tax Recapture

The scoring model assumes that 80% of U.S. citizens will participate in The Leviticus 25 Plan.

Participants must give up their tax refunds through the Plan’s recapture provisions for the 5-year target period (2026-2030).

According to 2024 IRS Filing season statistics, through Dec 27, 2024: 104,866,000 total refunds were paid out, totaling $329.073 billion.

Refund totals have increased by ~$25.312 billion over the past seven years, from $303.761 billion (2018) to a current (estimated) $329.073 billion (2024), representing an average increase of $3.6 billion per year. 

A conservative estimated average of $3.6 billion per year (2026-2030) will be used for this recapture calculation.

2024: $329.1 billion

2025: $332.7 billion

2026: $336.3 billion

2027: $339.9 billion

2028: $343.5 billion

2029: $347.1 billion

2030: $350.7 billion

Total: $1.718 trillion

Total recapture X 80%: $1.717 trillion X .8 = $1.374 trillion

Total recapture per annum (2026-2030): $1.374 trillion / 5 = $274.8 billion

Source(s): https://www.irs.gov/newsroom/filing-season-statistics-by-year

____________________

Means-tested welfare / Economic Security Programs – Recapture

Participants in the Plan will forego Economic Security Program benefits and select means-tested welfare benefits for the period 2026-2030.

Economic security programs: About 11 percent (or $742.5 billion) of the federal budget in 2024 supported [safety net] programs that provide aid (other than health insurance or Social Security benefits) to individuals and families facing hardship. Economic security programs include: the refundable portions of the Earned Income Tax Credit and Child Tax Credit, which assist low- and moderate-income working families; programs that provide cash payments to eligible individuals or households, including unemployment insurance and Supplemental Security Income for low-income people who are elderly or disabled; various forms of in-kind assistance for low-income people, including the Supplemental Nutrition Assistance Program (formerly known as food stamps), school meals, low-income housing assistance, child care assistance, and help meeting home energy bills; and other programs such as those that aid abused or neglected children.1

Source: https://www.cbpp.org/research/federal-budget/where-do-our-federal-tax-dollars-go

The Plan assumes a modest 1.5% growth / year:

2024:  $742.500 billion

2025:  $742.500 billion + $11.138 billion = $753.638 billion

2026:  $753.638 billion + $11.305 billion = $764.943 billion

2027:  $764.943 billion + $11.474 billion = $776.417 billion

2028:  $776.417 billion + $11.646 billion = $788.063 billion

2029:  $788.063 billion + $11.821 billion = $799.884 billion

2030:  $799.884 billion + $11.998 billion = $811.882 billion

Total projected federal means-tested welfare outlays 2026-2030 = $3.941 trillion

Assuming 80% participation: $3.941 trillion x .8 = $3.153 trillion

Total Means-tested Welfare recapture during the 5-year target period (2026-2030):  $3.153 trillion 

Source(s): https://www.cbpp.org/research/federal-budget/where-do-our-federal-tax-dollars-go

https://www.ssa.gov/policy/docs/statcomps/ssi_monthly/2024-11/table01.html

https://turbotax.intuit.com/tax-tips/general/how-are-federal-taxes-spent/L6kinGuUt : “Safety net programs, including unemployment insurance, food stamps, and low-income housing assistance, make up about 11% of your federal budget [$742.5 billion].”

https://fiscaldata.treasury.gov/americas-finance-guide/federal-spending/ 2024 – $6.75 trillion”

The Leviticus 25 Plan Generates $36.568 Billion Federal Budget Surpluses Annually (2026-2030). Part 3: Medicaid, Medicare, VA, TRICARE, FEHB, SSDI Recapture

The Leviticus 25 Plan – the most powerful economic acceleration plan in the world: economic scoring summary.

________________________

Medicaid/CHIP RecaptureThe Leviticus 25 Plan assumes 80% participation by Medicaid / CHIP enrollees.

Each U.S. citizen participating in The Plan will receive a $30,000 deposit, funded through a Federal Reserve / U.S. Treasury Department-based Citizens Credit Facility, into a personal Medical Savings Account (MSA).

Within this comprehensive economic plan, The U.S. Health Care Freedom Plan provides Medical Savings Account (MSA) funding of $30,000 to cover the $6,000 deductible for Medicaid and CHIP eligible primary care events and select out-patient care services – primarily related to routine medical appointments, Medicaid prescription events, disease state monitoring clinics, and other desired primary care services.

August 2024 Medicaid & CHIP Enrollment – 79,440,518 individuals were enrolled in Medicaid and CHIP in the 50 states and the District of Columbia that reported enrollment data for August 2024.  72,288,385 people were enrolled in Medicaid.  7,152,133 people were enrolled in CHIP.

Using a conservative estimate of 79.5 million for 2025, with a projected annual growth rate of 2%:

2025:  79.5 million

2026:  81.09 million

2027:  82.71 million

2028:  84.36 million

2029:  86.05 million

2030:  87.77 million

Total:  421.98 million receiving benefits 2026-2030

Average annual enrollment (2026-2030): 84.4 million

84.4 million X .8 = 67.52 million X $6,000/year X 5 years = $2.026 trillion

Total Medicaid/CHIP recapture during the 5-year target period (2026-2030):  $2.026 trillion 

Source(s): https://www.medicaid.gov/medicaid/program-information/medicaid-and-chip-enrollment-data/report-highlights/index.html

https://www.healthcarefinancenews.com/news/medicaid-enrollment-higher-pandemic-kff-finds

Note 1:  The potential savings of $2.296 trillion does not take into account the additional savings to state and local government outlays, which range from 17% to 39% of total Medicaid-CHIP spending.

Sourcehttps://www.kff.org/medicaid/state-indicator/federalstate-share-of-spending/?currentTimeframe=0&sortModel=%7B%22colId%22:%22Location%22,%22sort%22:%22asc%22%7D

Note 2:  The potential savings of $2.026 trillion does not take into account the certainty of additional savings from individuals no longer being eligible for Medicaid-CHIP, due to their improving financial status.

______________________

Medicare RecaptureThe Leviticus 25 Plan assumes 80% participation by Medicare enrollees.

Each U.S. citizen participating in The Plan will receive a $30,000 deposit, funded through a Federal Reserve / U.S Treasury Department-based Citizens Credit Facility, into a personal Medical Savings Account (MSA).

Within this comprehensive economic plan, The U.S. Health Care Freedom Plan provides

Medical Savings Account (MSA) funding of $30,000 to cover a $6,000 annual deductible for Medicare-eligible primary care events and select out-patient services – primarily related to routine medical appointments, Medicare Part D prescription events, disease state monitoring clinics, and other desired primary care services.

There were 67.8 million people are enrolled in Medicare as of August 2024. 

Projection: Medicare spending growth is projected to average 7.2% over 2021-2030, the fastest rate among the major payers. Projected spending growth of 11.3% in 2021 is expected to be mainly influenced by an assumed acceleration in utilization growth, while growth in 2022 of 7.5% is expected to reflect more moderate growth in use, as well as lower fee-for-service payment rate updates and the phasing in of sequestration cuts. Spending is projected to exceed $1 trillion for the first time in 2023. By 2030, Medicare spending growth is expected to slow to 4.3%.

Source(s): https://data.cms.gov/summary-statistics-on-beneficiary-enrollment/medicare-and-medicaid-reports/medicare-monthly-enrollment

https://www.cms.gov/newsroom/press-releases/cms-office-actuary-releases-2021-2030-projections-national-health-expenditures

Applying a conservative projected enrollment growth rate of 4.0% annually through 2030,        

for the 5-year target period (2026 – 2030):

2024:  67.80 X .8 X $6,000 = $325,440,000

2025:  70.51 X .8 X $6,000 = $338,448,000

2026:  73.33 X .8 X $6,000 = $351,998,000

2027:  76.26 X .8 X $6,000 = $366,048,000

2028:  79.31 X .8 X $6,000 = $380,688,000

2029:  82.48 X .8 X $6,000 = $395,904,000

2030:  85.78 X .8 X $6.000 = $411,744,000

Total Medicare recapture during the 5-year target period (2026-2030):  $1.906 trillion  

Detailed enrollment data can be viewed here: https://data.cms.gov/summary-statistics-on-beneficiary-enrollment/medicare-and-medicaid-reports/medicare-monthly-enrollment. The data now include counts of Part D enrollees receiving the low-income subsidy.

_______________

VA HealthcareThe Leviticus 25 Plan assumes 80% participation by Veterans Administration healthcare enrollees.  Within this comprehensive structure, The U.S. Health Care Freedom Plan provides Medical Savings Account (MSA) funding of $30,000, through a Federal Reserve / U.S. Treasury-based Citizens Credit Facility, to cover annual $6,000 deductibles for VA healthcare services over the course of the 5-year target period (2026-2030).

FY 2022 – 9.1 million enrollees in the VA health care system.

The plan assumes a conservative 2% growth rate in VA Health Care enrollment / inflation adjusted costs (2026-2030).

2024: 9.10 X 0.8 X $6,000  =  $43,680,000,000

2025: 9.28 X 0.8 X $6,000  =  $44,544,000,000

2026: 9.47 X 0.8 X $6,000  =  $45,456,000,000

2027: 9.66 X 0.8 X $6,000  =  $46,368,000,000

2028: 10.05 X 0.8 X $6,000 = $48,240,000,000

2029: 10.25 X 0.8 X $6,000 = $49,200,000,000

2030: 10.46 X 0.8 X $6,000 = $50,208,000,000

Total recapture:  $239,472,000,000

Average annual recapture (2026-2030): $239.472 billion / 5 = $47.894 billion

Total recapture 2026-2030:  $239.472 billion

Source: https://www.va.gov/health/aboutvha.asp                                                       

_________________________         

TRICAREThe Leviticus 25 Plan assumes 80% participation by TRICARE enrollees.

Through The U.S. Health Care Freedom Plan, participating members will receive a Medical Savings Account (MSA) funding injection of $30,000, through a Federal Reserve / U.S. Treasury Department-based Citizens Credit Facility, to cover annual $6,000 deductibles for desired primary care and out-patient services over the course of the 5-year target period (2026-2030).

There are currently ~9.5 million U.S. citizen beneficiaries in various locations around the world.

Recapture – total (2026-2030):  9.5 million X 0.8 X $6,000 X 5 years:  $228.0 billion

Source:  https://health.mil/Military-Health-Topics/MHS-Toolkits/Media-Resources/Media-Center/Patient-Population-Statistics/Patient-Numbers-By-State

______________________________                 

Federal Employee Health Benefits (FEHB)The Leviticus 25 Plan assumes 80% participation by FEHB enrollees.

Participating members will receive a Medical Savings Account (MSA) funding injection of $30,000, through a Federal Reserve / U.S. Treasury Department-based Citizens Credit Facility, to cover annual $6,000 deductibles for desired primary care and out-patient services over the course of the 5-year target period (2026-2030).

FEHB Program carriers cover most active, full-time civilian employees and retirees of the U.S. government and their families. The Program now provides benefits to nearly 8.3 million federal enrollees and dependents and offers our 180 health plan choices to federal members.

Note – the Federal government also pays approximately 72% of premium costs per enrollee.

Recapture – total (2026-2030): 8.3 million X 0.8 X $6,000 X 5 = $199.200 billion

Source:  https://www.bu.edu/sph/news/articles/2023/professor-collaborates-with-federal-agency-to-study-employee-health-insurance-utilization/  

________________________ 

Social Security Disability Income (SSDI)The Leviticus 25 Plan specifies that qualifying participants will not be eligible for SSDI benefits.

The Plan assumes 80% participation.

Number, average, and total monthly benefits, November 2024: 8,336,000 recipients

Total annual SSDI payments, November 2024: $140.496 billion.

This projection assumes a conservative 3% growth per year for 2026-2030, covering both enrollment growth and COLA:  

2024:  $140.496 billion

2025:  $144.711 billion

2026:  $149.052 billion

2027:  $153.524 billion

2028:  $158.130 billion

2029:  $162.874 billion

2030:  $167.760 billion

Total:  $791.340 billion / Average per year: $158.268 billion

Total for 5-year target period 2026-2030:

Plan assumes 80% participation – recapture:  $791.340 billion X 0.8 = $633.072 billion

Source(s): Social Security Benefits Dec 2023 – Disability Insurance

https://www.cbpp.org/research/social-security/social-security-disability-insurance-0

“SSDI benefits are financed primarily by part of the Social Security payroll tax and totaled about $152 billion in 2023.”

“Social Security’s trustees project that the share of people in the United States receiving SSDI will rise somewhat over the next 20 years and then remain stable.”

Note:  The 3% growth projection, covering both the enrollment increase and annual COLA, is likely a conservative estimation for the period 2026-2030.

______________________________

The Leviticus 25 Plan Generates $36.568 Billion Federal Budget Surpluses Annually (2026-2030). Part 4: Interest Expense Recapture

The Leviticus 25 Plan – the most powerful economic acceleration plan in the world: economic scoring summary.

Interest expense on projected deficits 2026-2030

Federal debt has increased from $22.1 trillion in 2020 to $35.46 trillion as of December 2024. Federal debt held by the public is reported to be $27.783 trillion, with the remainder, $7.677 trillion of intra-governmental debt outstanding, which arises when one part of the government borrows from another. This intra-governmental debt interest expense will be omitted from this calculation, since those dollars are not expensed directly.

The Center Square, Dec 26, 2024:  As the debt grows, so does the average interest rate the government is paying. That rate jumped from 2.378% five years ago to 3.155% now. Since one of the key drivers of U.S. debt growth is interest on the debt, a vicious spending cycle has been created, one that lawmakers in the U.S. House Committee on the Budget recently called “completely unsustainable.”

The Bear Traps Report, Dec 30, 2024 – Excerpts:

CBO data, Bloomberg. The average weighted coupon on the U.S. debt load is about 2.7% vs. over 4.5% for 10-year U.S. Treasuries. As bonds mature, they get refinanced at much higher yields.”

“$10Tr of Debt Refinancing Next Year – In 2024 Treasury faced around $10Tr of maturing debt. To refinance this debt, it issued a whopping $26Tr of bills and bonds. More than 84% of that paper was short-term bills with a maturity of 6 months or less. Treasury keeps re-issuing bills with a maturity of 4 to 8 weeks or 3,4 to 6 months, which are the most popular maturities in a continuing, ever-increasing roll down of the debt, day after day, month after month.”

“ALERT – By issuing nearly a colossal load of extremely short-term bills, Janet Yellen succeeded in suppressing bond volatility in an election year and, in our view, strategically placing that bond market volatility into 2025 after the election. You can “why” see above, she wanted LESS long-term paper in circulation markets in the election year.”

“Now, in 2025 – this paper has to be rolled over and termed out into longer-dated bonds. The USA is behaving like a financially trapped emerging market country. Living on the “front-end” of the yield curve is a VERY dangerous game.”  

“Incoming Stress Points – In 2025 the U.S. Treasury faces $9.6Tr of maturities in their so-called publicly held debt. In Q1 alone — the government faces $5.58Tr of maturities (bonds coming due, redemption), but 86% of those are short-term bills that the Treasury department rolls over into new 4-week, 8-week, 3,4, or 6-month bills, among others.”

“As a result, almost daily bill auctions are coming to a theater near you, as the Treasury Department mindlessly keeps pushing new paper into the market to pay back the colossal amount of maturing debt.”

This projection will assume an average monthly interest rate of 3.13% for 2025, and a conservative average monthly interest rate of 3.00% in calculating the interest expense to be eliminated during the budget surplus years of 2026-2030.

This projection also assumes that annual federal budget deficits will be funded through Treasury Issuance at an average of 79.0% rate for Debt Held by the Public.

Year    Annual Deficit/2 

2025:  $1.938 trillion/2 X .79 X .03 = $22.965 billion

2026:  $1.851 trillion/2 X .79 X .03 = $21.934 billion

2027:  $1.756 trillion/2 X .79 X .03 = $20.809 billion

2028:  $1.942 trillion/2 X .79 X .03 = $23.013 billion

2029:  $1.949 trillion/2 X .79 X .03 = $23.096 billion

2030:  $2.193 trillion/2 X .79 X .03 = $25.987 billion

Recapture:  Total interest expense eliminated by projected operating surpluses: $114.839 billion

Source(s):  https://www.thecentersquare.com/users/profile/therese%20boudreaux https://www.thebeartrapsreport.com/blog

___________________________ 

The Leviticus 25 Plan Generates $36.568 Billion Federal Budget Surpluses Annually (2026-2030). Part 5: Current Economic Scoring – Summary Totals

The Leviticus 25 Plan – the most powerful economic acceleration plan in the world: economic scoring summary.

Economic Scoring – Update

Subtotals:

CBO projected deficit summary (2026-2030): $9.691 trillion

Recapture gains (2026-2030):

Federal Income Tax recapture benefit:          $1.374 trillion

Safety Net Program recapture benefit:           $3.153 trillion

Medicaid/CHIP $6,000 deductible recapture $2.026 trillion

Medicare $6,000 deductible recapture:          $1.906 trillion

VA $6,000 deductible recapture:                   $239.472 billion

TRICARE $6,000 deductible recapture:        $228.000 billion

FEHB $6,000 deductible recapture:               $199.200 billion

SSDI recapture:                                              $633.072 billion

Subtotal Summary:  $9.759 trillion               

Net surplus subtotal (before interest savings): $9.759 trillion$9.691 trillion = $68.0 billion

…………………………….

Totals Summary

The Leviticus 25 Plan budget surplus

Totals – 2026-2030:

5-year projected deficit (CBO): $9.691 trillion

5-year projected recapture (subtotal):  $9.759 trillion

5-year projected interest expense savings: $114.839 billion

Budget surplus (projected) 2026-2030:

$9.832 trillion – $9.691 trillion = $68.0 billion

Budget surplus (projected) 2026-2030 with interest expense savings:

$68.0 billion + $114.839 billion = $182.839 billion

Average annual budget surplus (projected) 2026-2030: $182.839 billion / 5 years: $36.568 billion per year

___________________________________  

Note 1:  Projected budget surpluses for 2026-2030 do not factor in the additional government tax revenue gains that would accrue from the massive shift in capital away from debt service and into productive economic activity.

Note 2:  Projected budget surpluses for 2026-2030 do not factor in the additional government tax revenue gains that would accrue from significantly lower levels of debt deductibility on individual income tax filings. 

Note 3:  Projected budget surpluses from the Medicaid / CHIP recapture do not take into account the likelihood of fewer citizens actually qualifying for Medicaid / CHIP benefits.

Note 4:  Projected budget surpluses from Interest Expense Reductions during each of the first five years of activation (2026-2030) is likely understated due to the fact that ‘debt held by the public’ is projected to increase by 8.5% per year, from $28.278 trillion in 2026 to $40.198 trillion in 2030.

Note 5The Plan’s funding of individual Medical Savings Accounts (MSAs) with the $6,000 deductible provision per year would result in an enormous drop in the number of claims each year for Medicare reimbursement. Medicare payroll taxes would generate a growing revenue stream, due to stronger economic growth, while outlays would drop significantly from the reduced claims numbers – thereby providing the Fed with a powerful tool to recapitalize the Medicare Trust Fund, vis the Citizen’s Credit Facility.

The Leviticus 25 Plan – Projection limitations

There can be no question that The Leviticus 25 Plan would generate healthy, broad-based economic growth from broad-based debt reduction and improved financial stability at the family level, the restoration of free market dynamics in commerce, and scaling back social program work disincentives.

The Leviticus 25 Plan does not attempt to project how much additional tax revenue and reduced cost of government will be realized, above and beyond the Recapture Provisions, over the course of the initial five years of the plan.  In that sense, The Plan understates the effect of additional dynamic economic benefits.

Robust funding of Medical Savings Accounts and the elimination of millions of insurance claims and claims resolutions for basic primary care and everyday healthcare purchases swill save millions of man-hours of health care cost on an annual basis.  Scaling back government involvement in basic primary care and everyday healthcare purchases for millions of Americans will also generate massive cost savings. 

The Plan makes no attempt to project the positive effects of the streamlined, consumer-driven efficiencies that will emerge, and the cost reduction and improvement in services.   

The Plan therefore understates the benefits.

The Plan projects an 80 percent participation rate by U.S. citizens.  It is assumed that a large number of wealthy Americans will not participate, because their tax refunds are larger than the annual Plan benefits.  And it is assumed that a large number of Americans receiving significant government benefits for extraordinary health or economic issues will also not participate.

Cost savings from the reductions in massive social welfare spending and other programs, like unemployment insurance, workman’s compensation, SSI and SSDI can be difficult to quantity, since state and federal funding mechanisms may both be involved in various ways. In that regard, The Plan may understate, or it may overstate, the benefits.

America’s Mushrooming Debt Solution: The Leviticus 25 Plan

The United States of America is sinking deeper and deeper into a swirling cavern of debt.

Neither the U.S. Treasury Department, nor the Federal Reserve, nor the U.S. Congress has any plan to return Federal, State, and Local governments to a lasting state of solvency. They have economically viable, politically feasible plan to help restore financial security for American families.

………………………………………….

Federal Reserve Bank of St. Louis | All Sectors Total Debt: ~$61.461 Trillion

……………………………………………

USDebtClock.org | Dec 21, 2024

State Debt: $1.332 trillion

Local Debt: $2.502 trillion

U.S. National Debt: $36.254 trillion

…………….

ZeroHedge Dec 21, 2024: Notice that the vast majority of Government spending is directly a function of the social welfare system and interest on the debt.”

………………………………………………………..

Total Household Debt: $17.94 Trillion | Federal Reserve Bank of New York, Q3 2024

……………………………………………

U.S. Corporate Debt has “climbed to approximately 25.6 trillion U.S. dollars. Of this latter total, 17.4 trillion U.S. dollars was debt issued by financial corporations.” Statista Jun 19, 2024

____________________________________

Meet the Main Street America Republican ‘block-buster’ debt elimination plan with the raw power and economic viability to clean up Social Welfare and Interest on the Debt burdens.

And the raw power to: (1) Set Federal, State, and Local governments back on course for long-term budget surpluses; (2) Restore financial security for millions of American families through massive reductions in Household Debt; (3) Revitalize long-term economic growth and financial health for corporate America; (4) Reestablish free market dynamics and economic liberty for all Americans.

The Leviticus 25 Plan is a dynamic economic initiative providing direct liquidity benefits for American families, while at the same time scaling back the role of government in managing and controlling the affairs of citizens.  It is a comprehensive plan with long-term economic and social benefits for citizens and government.

The inspiration for this plan is based upon Biblical principles set forth in the Book of Leviticus, principles tendering direct economic liberties to the people.

The Leviticus 25 Plan – An Economic Acceleration Plan for America

$90,000 per U.S. citizen – Leviticus 25 Plan 2025 (23695 downloads )