National Debt Plus Unfunded Liabilities: $151 Trillion.

Main Street America Republicans have the one and only economic acceleration plan on record with the raw power to eliminate public and private debt, strengthen the U.S. economy, and restore financial health for millions of hard-working American families….

………………………………………………………

Think America Owes $37 Trillion? It’s Far Worse Than That

Misleading accounting hides the stunning scale of DC’s financial obligations

Brian McGlinchey, Stark Realities | Aug 01, 2025

Excerpts:

When asked how far the US government has plunged into the red, many fiscally-conscious Americans will tell you the national debt has reached $37 trillion. As distressing as that official number is, America’s true fiscal situation is even worse — far worse. According to a barely-publicized Treasury report, the actual grand total of Uncle Sam’s obligations is more than $151 trillion.

That huge discrepancy springs from the fact that the federal government doesn’t hold itself to the same accounting standards it imposes on businesses. Rather than using accrual accounting — which recognizes expenses when they’re incurred — our Washington overlords self-servingly use simple cash accounting, only recognizing expenses when they’re paid. As a result, discourse on federal obligations solely focuses on the national debt, comprising Treasury bills, notes and bonds.

Once a year, however, an obscure report delivers a more accurate version of Uncle Sam’s balance sheet. While it receives almost no attention from journalists or public officials, the Treasury Department is required to submit an annual report to Congress detailing the government’s financial condition. Critically, the 1994 law compelling this report mandates that it reflect “unfunded liabilities” — that is, commitments made without any dedicated assets or income streams to ensure they’ll be kept.

…..

One of the larger categories of those unfunded liabilities is future federal employee and veterans benefits. At the end of the 2024 fiscal year, this alone represented a $15 trillion obligation. However, by leaps and bounds, the largest unfunded liabilities spring from America’s social insurance obligations — primarily Social Security and Medicare. At fiscal-year end, these liabilities totaled a towering $105.8 trillion.

Stacking these and other unfunded liabilities on top of the publicly-held national debt and other obligations, you arrive at a grand total of $151.3 trillion at the end of the 2024 fiscal year. Offsetting that by an estimated $7.9 trillion in US government commercial assets — including property, plant, equipment and purported gold holdings — a Just Facts analysis puts Uncle Sam at an overall net-negative $143 trillion.

……………..

Wrangling over the budget isn’t going to save us. Congressional debates tend to center on discretionary spending — outlays that require a vote by Congress during the appropriations process. However, America’s steady march to insolvency is driven by so-called mandatory spending, which is hardwired by previously-enacted laws.

In what may be the most ominous indication that the government is on an autopilot-course for catastrophe, the proportion of total federal outlays driven by mandatory spending has more than doubled since 1965 — from 34% to 73% in 2024. It was at 71% just two years earlier, in 2022.
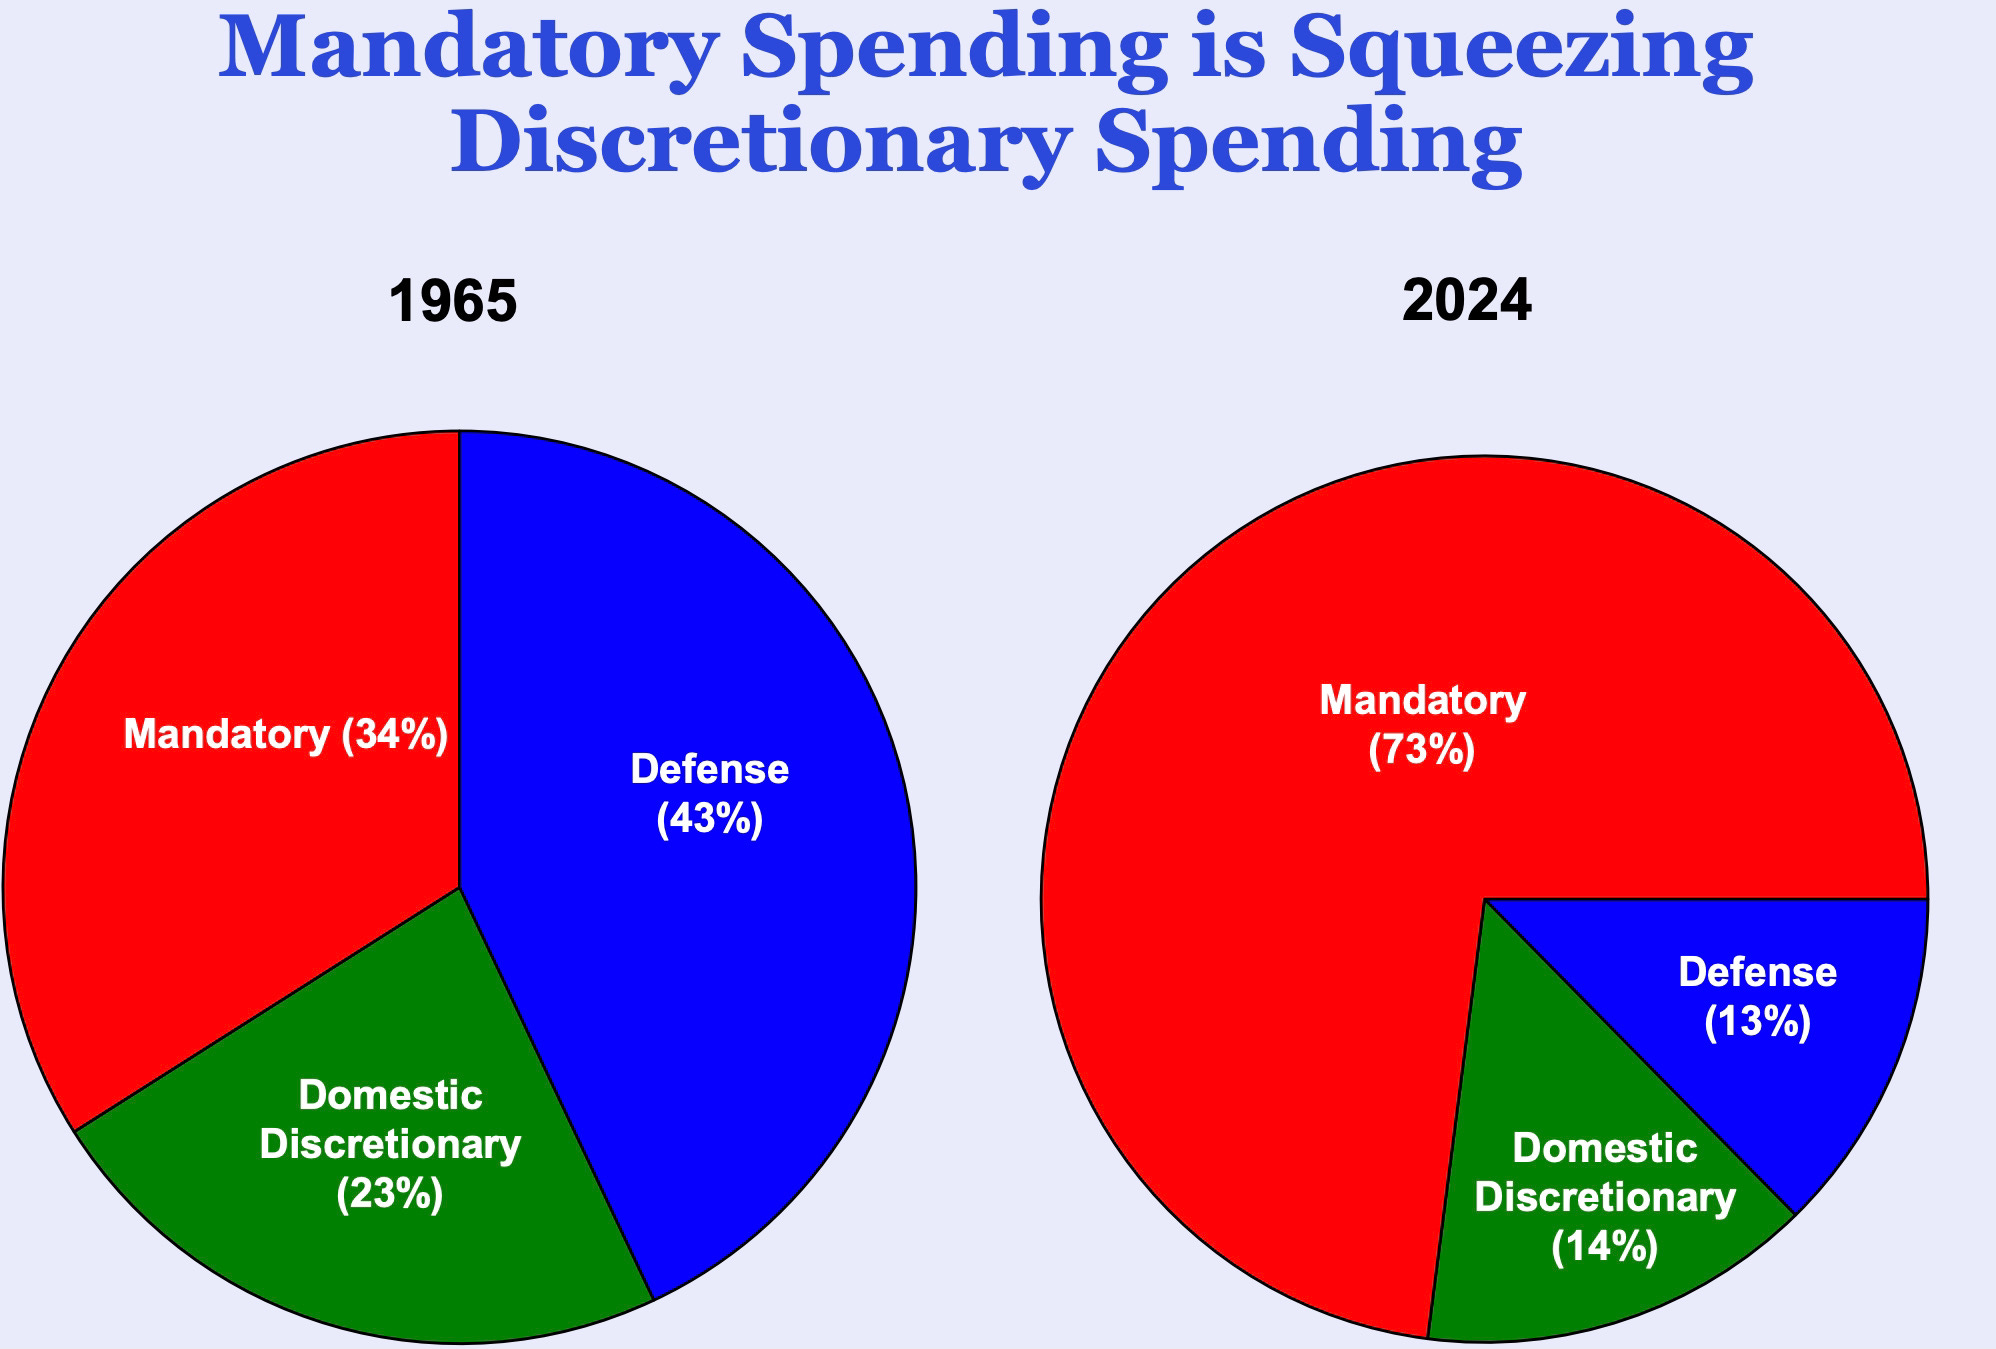
From Manhattan Institute’s Spending, Taxes & Deficits: A Book of Charts

The two largest examples of mandatory spending are Social Security and Medicare. Those old-age programs are now well within sight of a crisis that’s been warned about for a generation: According to the latest report from their program trustees, Social Security and Medicare trust funds are now just seven years from insolvency.

……….

There’s another key component of mandatory spending that isn’t counted in the national debt: interest payments on debt issued to cover past and current spending. “In total, social programs and interest on the national debt—which mainly stems from social programs—account for 75% of all federal spending,” notes Agresti.

Interest payments also represent a steadily growing share of total outlays, and will total almost $1 trillion this year. Within 10 years, they’re projected to reach $2 trillion, roughly equal to the entire 2025 deficit. Last year saw a grim milestone, as interest expense surpassed spending on both defense and Medicare.
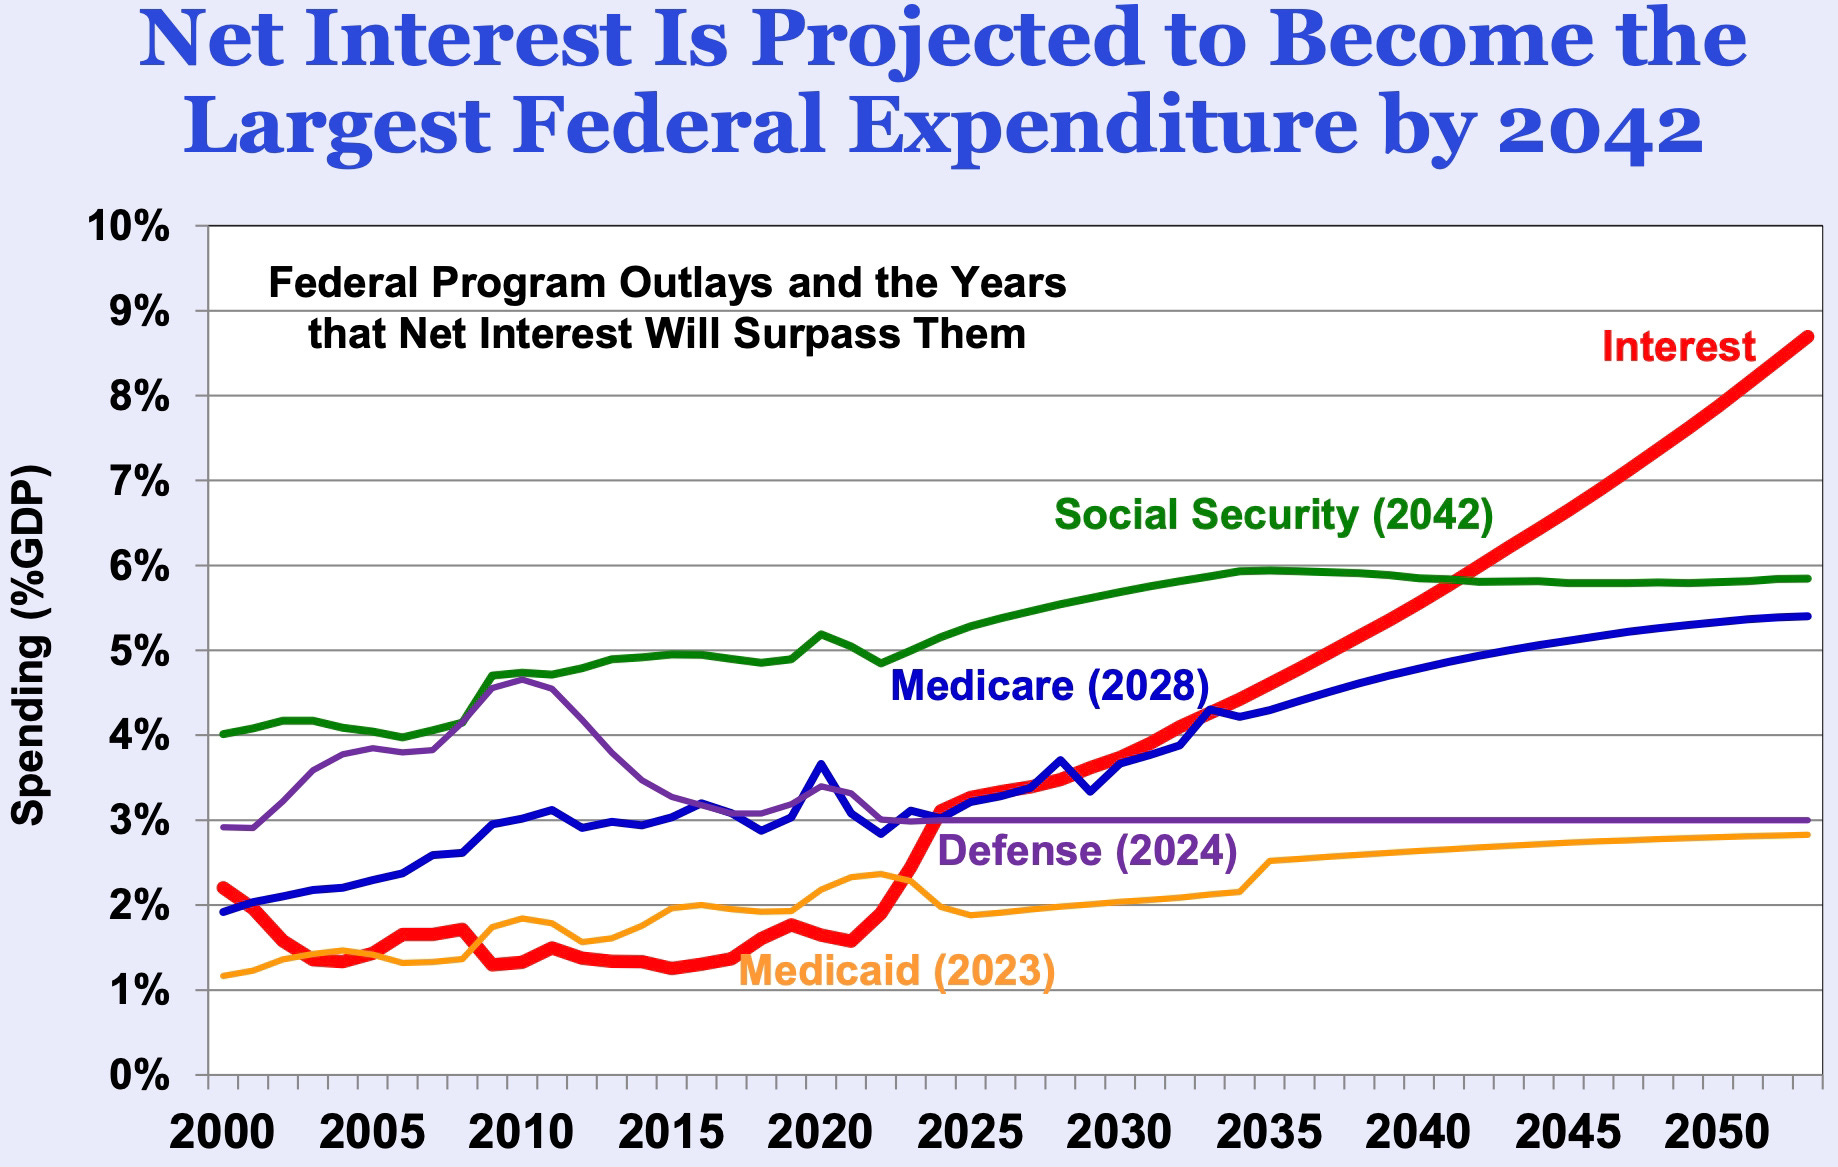
From Manhattan Institute’s Spending, Taxes & Deficits: A Book of Charts

Current projections have interest surpassing Social Security to become the largest single expenditure by 2042, but don’t be surprised if that milestone doesn’t come sooner. The government is already descending into a vicious cycle in which mounting US debt has the buyers of that debt demanding higher interest rates in compensation for the growing risk of inflation and/or default — with those higher rates creating larger interest payouts and even more debt.

Beyond mandatory-vs-discretionary, and funded-vs-unfunded, there’s an even more important but far-less-discussed classification of spending that goes to the very heart of America’s march toward financial disaster: constitutional vs unconstitutional. As I noted in the most-read article at Stark Realities, “Americans Are Fighting For Control Of Federal Powers That Shouldn’t Exist”:

Today’s sprawling federal government, which involves itself in almost every aspect of daily American life, is almost entirely unconstitutional.

To rattle off just a random fistful of the federal government’s unauthorized undertakings and entities — brace yourself — there is zero constitutional authority for the Social Security, Medicare, federal drug prohibitions, the Small Business Administration, crop subsidies, the Department of Labor, automotive fuel efficiency standards, climate regulations, the Federal Reserve, union regulation, housing subsidies, the Department of Agriculture, workplace regulations, the Department of Education, federal student loans, the Food and Drug Administration, food stamps, unemployment insurance or light bulb regulations. Even that sampling doesn’t begin to fully account for the scope of the unsanctioned activity.

This Pandora’s box of unconstitutional endeavors was opened wide by unconscionably expansive Supreme Court interpretations of the Constitution in the 1930s. It’s no coincidence that federal spending represented a mere 3% of GDP in 1930 but soared to an economy-warping 23% by 2024.

Now we find the federal government in a $143 trillion hole, a burden that comes out to $1,085,022 per US household. History suggests this will end with a government default. In the United States, that will likely occur not via an explicit repudiation of the debt, but through rampant price inflation as the Treasury and the Federal Reserve conspire to create new money out of thin air to make debt payments.
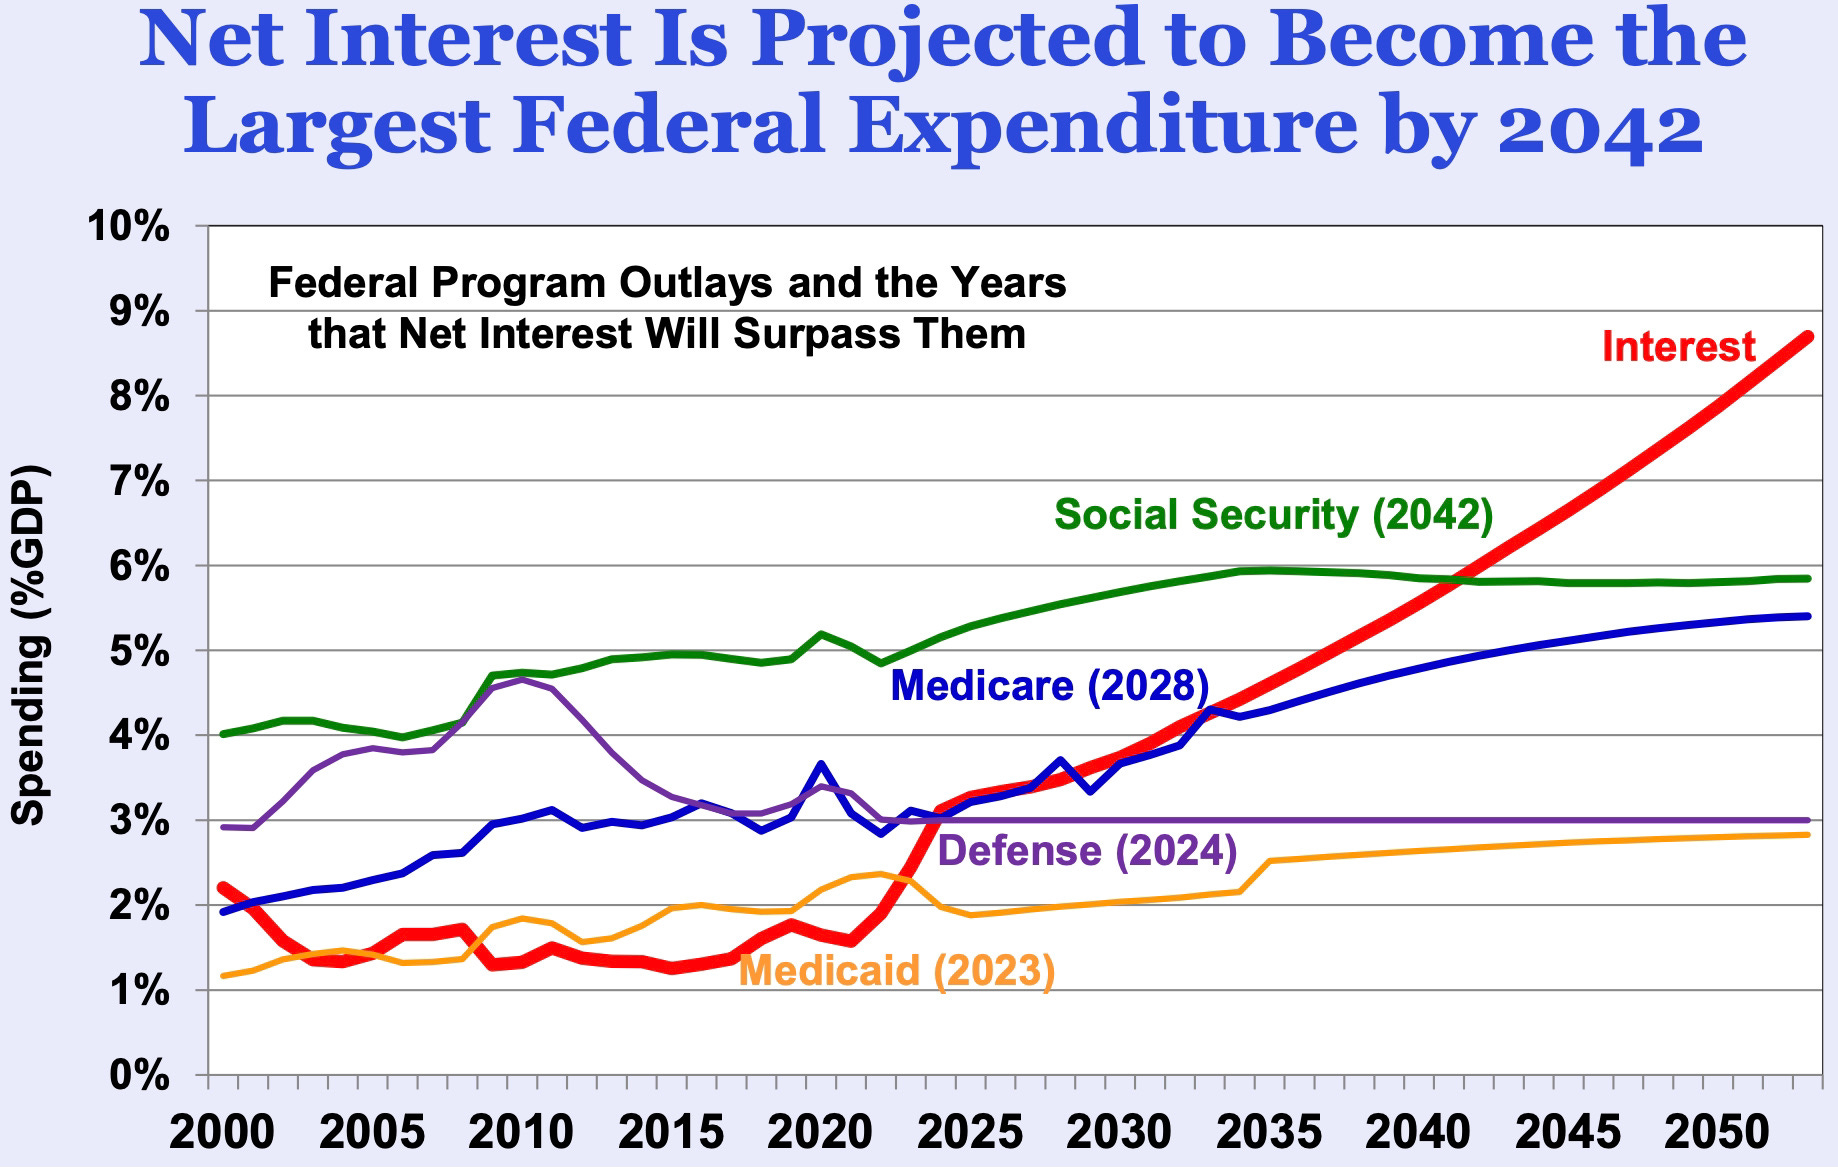
From Manhattan Institute’s Spending, Taxes & Deficits: A Book of Charts

“They can’t pay the debt, so they have to liquidate the debt,” said former Congressman Ron Paul in a June conversation with David Lin. “They [won’t] default — they’re always going to pay something for the Treasury bills. What they’re going to do is liquidate the debt by paying it off with counterfeit money.”

While the Fed-Treasury money creation scheme has been with us for a long time, the alarming trajectory of federal debt and spending point to future money-printing on a scale that will trigger hyperinflation and economic collapse. At that point, Americans will stand at a crossroads. Desperation and fear will make them susceptible to the siren song of even more authoritarianism and unconstitutional, centralized command of the economy and society than what put them in such dire straits to begin with.

“People will want to be taken care of,” Paul said. “I see it as an opportunity. If people are promoting the cause of liberty and there’s chaos in the streets, we better get out there and lead the charge and say you don’t need more of what caused this. You don’t need more authoritarianism. What you need is more liberty and more peace, and that means you ought to obey the Constitution.”

________________________________

Mr. Ron Paul, meet The Leviticus 25 Plan:
1) Preserve the cause of liberty and economic freedom for all Americans;
2) Restore financial security to millions of America’s hard-working, tax-paying U.S. citizen families;
3) Reverse big-government “centralized command of the economy and society”;
4) Eliminate massive amounts of entitlement program outlays;
5) Restore citizen-centered health care in America;
6) Generate $37.303 billion federal budget surpluses each of it first five years of activation (2027-2031);
7) Eliminate the looming threat of credit market disorder and banking system instability.

The Leviticus 25 Plan is a dynamic economic initiative providing direct liquidity benefits for American families, while at the same time scaling back the role of government in managing and controlling the affairs of citizens.  It is a comprehensive plan with long-term economic and social benefits for citizens and government.

The inspiration for this plan is based upon Biblical principles set forth in the Book of Leviticus, principles tendering direct economic liberties to the people.

The Leviticus 25 Plan – An Economic Acceleration Plan for America

$95,000 per U.S. citizen – Leviticus 25 Plan 2026 (44822 downloads )

Fed IORB Payments Subsidize Wall Street’s Largest Banks, Major Foreign Banks

U.S. Senate Committee on Homeland Security & Governmental Affairs – December 2025

Excerpts:

Executive Summary

On July 15th, 2025, Chairman Rand Paul of the U.S. Senate Committee on Homeland Security and Governmental Affairs (HSGAC) launched an investigation on the Federal Reserve’s use of Interest on Reserve Balances (IORB). After months of correspondence, the Federal Reserve Board of Governors produced over 40,000 pages of documents detailing IORB payments for every two-week period from July 2013 through July 2025.

July 2013 through July 2025. This report outlines the following key findings from the contents of the data:

  1. IORB payments equal 10 percent of the Federal Deficit:
    a. The magnitude of IORB payments equaled 10.3 percent ($187 billion) of the
    FY24 Federal deficit and 8.8 percent ($149 billion) of the FY23 deficit.
  2. The Federal Reserve has used IORB payments to subsidize Wall Street’s largest banks:
    a. IORB payments account for 12 percent of all profits for the 5 largest American
    banks from 2013-2024.
    b. In 2024, IORB payments accounted for 16 percent of U.S. banking sector’s
    net interest income.
    c. The top 20 banks account for over half ($305 billion) of total payments with
    the remaining 4,500 banks accounting for the remaining half ($302 billion).
  3. IORB payments are also subsidizing foreign banks:
    a. 11 of the top 20 recipients of IORB payments are foreign banks.
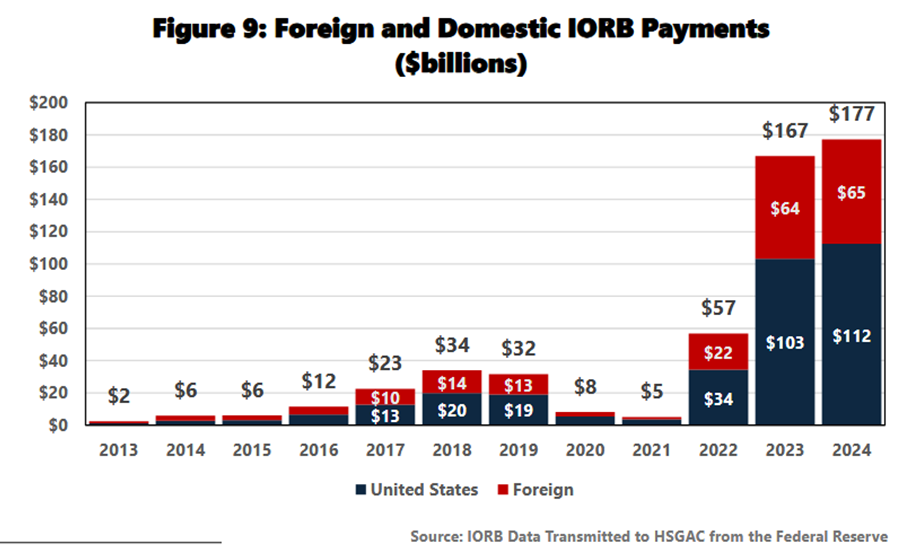
    b. From July 2013 – July 2025, $235 billion has been paid to foreign banks by
    the Fed through IORB payments (see figure 9).
    c. $10 billion of these payments were made to Chinese banks such as Bank of
    China, China Construction Bank, Industrial and Commercial Bank of China,
    and Bank of Communication…..

…………

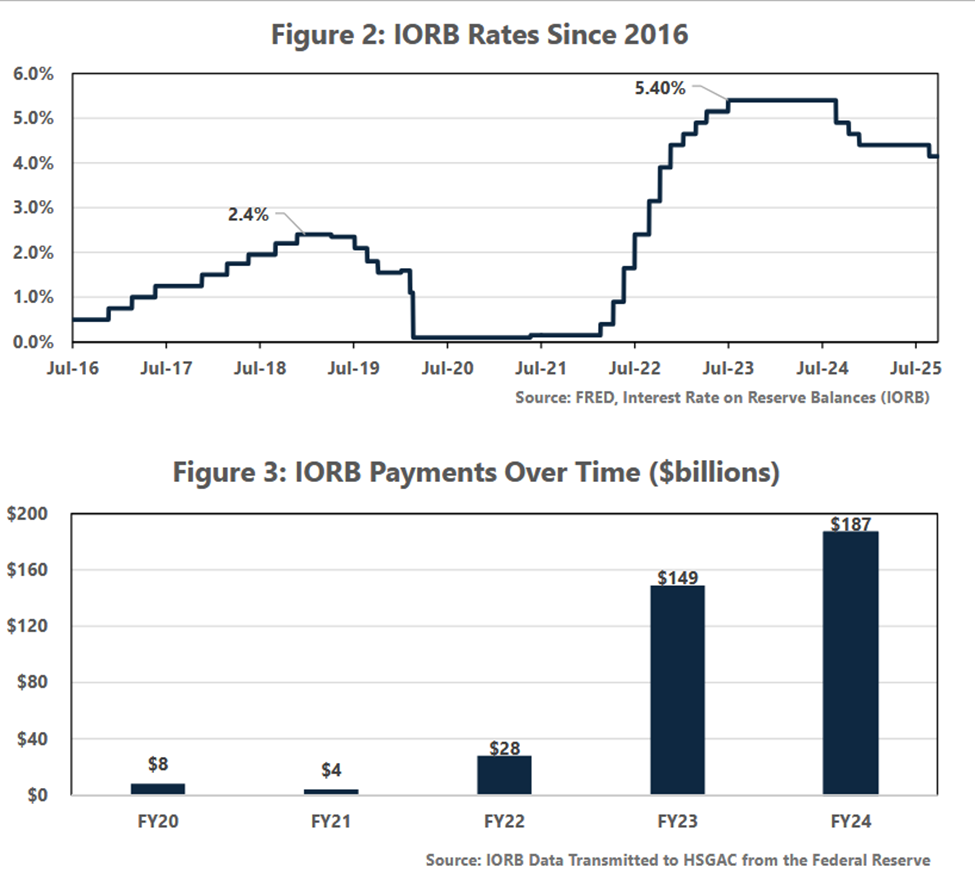
IORB Rates Rise

Prior to 2021, IORB rates peaked at 2.4 percent, however in the inflationary period after the COVID stimulus in 2021, the Fed began to raise rates in an attempt to rein in inflation. The Fed raised IORB rates to a high of 5.4 percent in July 2023 (see figure 2).

The Fed’s increased IORB rates incentivized eligible domestic and foreign banks to place reserves at the Fed instead of lending out these funds, buying treasury bills, or other financial activities effectively setting a floor on interest rates. IORB payments from the fed ballooned from an average of $17 billion prior to the pandemic to over $100 billion in each of the last two fiscal years (See figure 3).

IORB Payments as Corporate Welfare

Introduction – IORB payments, as currently structured, take the Fed’s operating profits that could be used to pay down the deficit and pay these funds out to the world’s largest banks. Since 2013, the Fed has paid $607 billion in identified payments to both foreign and domestic financial institutions to keep their reserves idle and interest rates artificially high. This costly means of conducting monetary policy has prevented the Fed from remitting profits to Treasury to pay down the Federal deficit and instead directed these funds into Wall Street’s profit margins.

Characteristics of IORB Payment Recipients

Analysis of these payments shows that large banks are the primary beneficiary of this reallocation of taxpayer funds. The allocation of IORB payments is disproportionately skewed to large financial institutions. The top 20 bank recipients (see Figure 6) received approximately the same amount of IORB payments from 2020-2025 ($305 billion) as the next 4,500 banks received ($302 billion).

IORB Payments as a Driver of Bank Profits

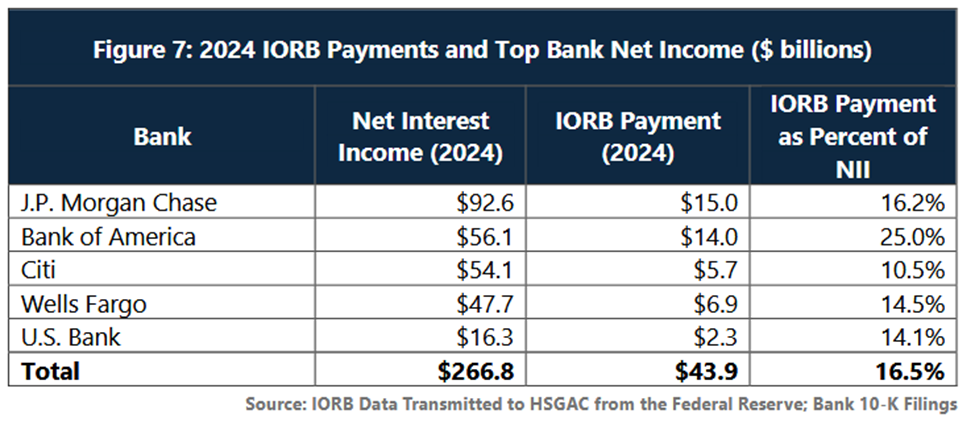
The five largest banks in the U.S. by consolidated assets: JP Morgan Chase, Bank of America, Citibank, Wells Fargo, and U.S. Bank received $136 billion in IORB payments from 2013 to 2024, with 2024 payments alone amounting to $43.9 billion. In 2024, taxpayer-financed IORB payments were a considerable driver for profitability for these banks accounting for 16.5 percent of net interest income for the U.S.’s 5 largest banks in 2024. Looking at the entirety of the banking sector, IORB payments accounted for 16.1 percent of all net interest income of U.S. banks in 2024.

……….

Share of Foreign and Domestic Payments

While the proportion of IORB payments to foreign banks has decreased slightly since 2013, the gross amount in payments sent to foreign banks continues to grow substantially each year as the Fed has increased IORB rates. In 2019, prior to the pandemic, $13 billion in IORB payments were paid to foreign banks. Since 2022, however, the Fed has paid an average of $50 billion in IORB payments to foreign institutions and this number continues to grow.

As IORB rates drastically increased in late 2021 and 2022, not only did domestic banks rush to park capital at the Fed, but foreign banks also seemed to inject dormant capital from their international banks into their U.S. subsidiary to take advantage of the more generous risk-free interest offered for excess reserves. The share of IORB payments jumped from 28.5 percent foreign banks (the lowest since 2013) to nearly 40 percent of payments….

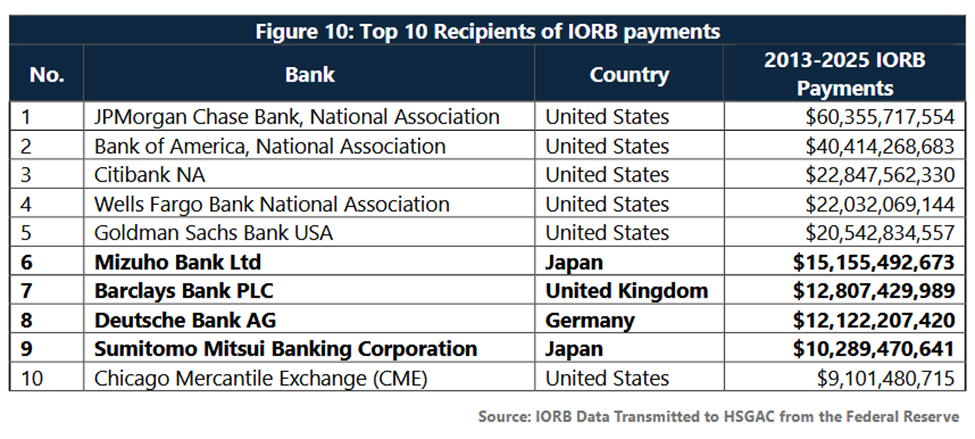
Many of the world’s largest banks have been the largest beneficiaries of IORB payments. Of top 10 recipients of IORB payments from July 2013 to July 2025, 4 are foreign banks (bolded), and 11 of the top 20 are foreign banks…:

IORB Payments as a Foreign Bank Subsidy

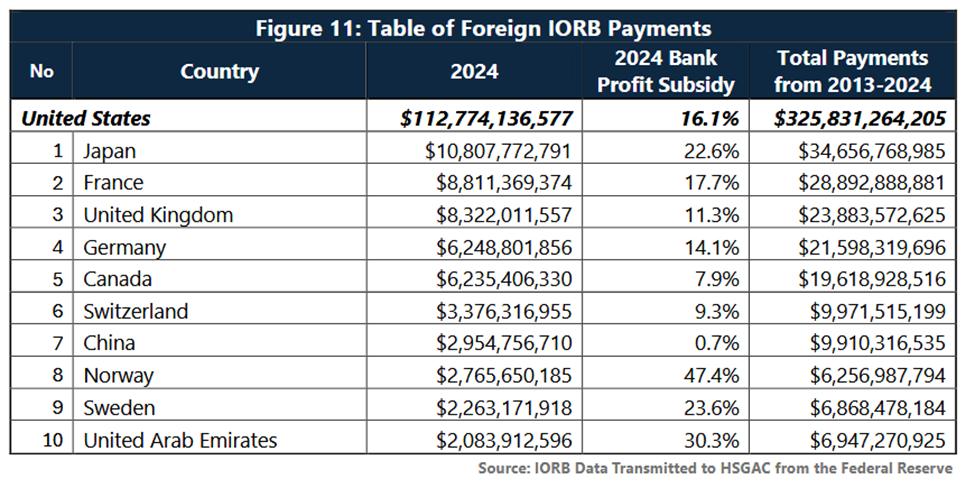
In 2024, while 16.1 percent of the U.S.’s banking sector’s net interest income comes at the expense of the taxpayer through IORB, 5 percent of all the participating foreign banks net interest income comes from the U.S. taxpayer. Figure 11 shows the top 10 benefitting nations and the percentage of bank profits  is subsidized by the U.S. taxpayer.

“Bank profit subsidy” reflects the percent of participating depository institution’s net interest income that is attributable to IORB payments from the Fed. Notably,

the American taxpayer has financed over 50 percent of Bahrain’s bank profits, 47 percent of Norway’s bank profits, and 22 percent of Japan’s bank profits…

Conclusion: Hundreds of billions of dollars for the taxpayer have been sent to foreign banks, hundreds of billions of dollars for the taxpayer have padded Wall Street’s profit margin, all without a single election, public debate, or independent audit. This is the first step in what should be a continued effort to audit the Federal Reserve.

Full report: https://www.tristatehomepage.com/wp-content/uploads/sites/92/2025/12/2025.12.08_IORB-Report-VFINAL.pdf

__________________________________

Again: “This costly means of conducting monetary policy has prevented the Fed from remitting profits to Treasury to pay down the Federal deficit and instead directed these funds into Wall Street’s profit margins.”

Federal budget deficits are skyrocketing as major Wall Street and foreign banks are being subsidized with hundreds of billions of dollars in Fed IORB payments.

Main Street America is paying a steep price for this ongoing kleptocratic snow job. The country is wallowing in debt… while the Fed is doling out hundreds of billions of dollars to pump up the profit margins of Wall Street’s largest banks and major foreign banks.

Main Street America Republicans have the plan to re-target Fed liquidity flows to pass through the hands of tax-paying U.S. citizens first, and then into the banking system (through Household debt service / elimination), and into America’s small business sector, and into savings and investing vehicles.

The Leviticus 25 Plan will generate federal budget surpluses of $37.303 billion each of its first five years of activation (2027-2031) and pay for itself entirely over the succeeding 10-15 years.

The Leviticus 25 Plan is a dynamic economic initiative providing direct liquidity benefits for American families, while at the same time scaling back the role of government in managing and controlling the affairs of citizens.  It is a comprehensive plan with long-term economic and social benefits for citizens and government.

The inspiration for this plan is based upon Biblical principles set forth in the Book of Leviticus, principles tendering direct economic liberties to the people.

The Leviticus 25 Plan – An Economic Acceleration Plan for America

$95,000 per U.S. citizen – Leviticus 25 Plan 2026 (43426 downloads )

Large Money Center Banks Thriving In Slumping, Debt-strapped U.S. Economy. Enter America’s Reset Blockbuster: The Leviticus 25 Plan

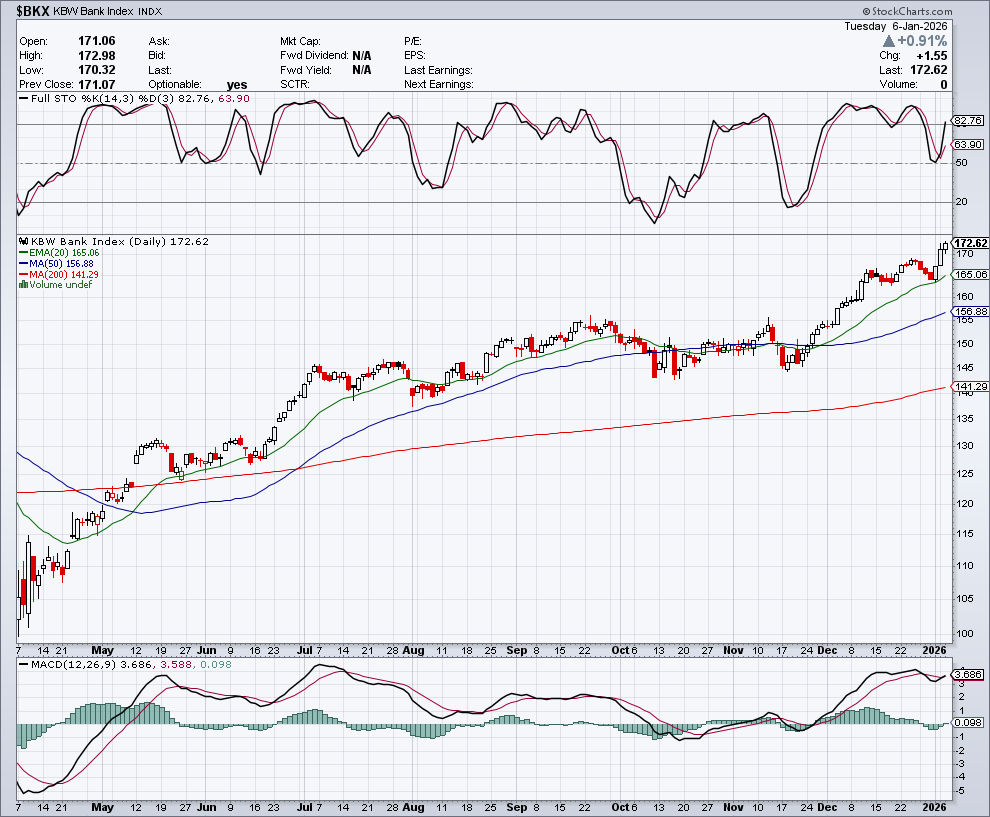
The KBW Index – large national money center banks have been faring very well, in what is otherwise a burdensome and stifling economic climate for businesses, working-class citizens, states, and student loan borrowers.

The KBW Index includes 24 banking stocks representing the large U.S. national money centers, regional banks and thrift institutions. The largest banks in the Index include:
JP Morgan Chase & Co.
Bank of America Corporation.
Wells Fargo & Company.
Morgan Stanley.
Goldman Sachs Group, Inc. ( The)
Citigroup
Capital One Financial Corporation.
U.S. Bancorp.

________________________________

Meanwhile across America: Businesses, working-class citizens, states, and student loan borrowers are not faring well…

Bankruptcies are exploding across the economy, hitting small businesses and households. Few industries are immune. – Business Insider

By Natalie Musumeci | Dec 27, 2025

  • From corporate giants to mom-and-pop shops, bankruptcies are piling up across the US this year.
  • Large corporate bankruptcies have hit their highest level in 15 years.
  • “Bankruptcies seem to be kind of all over the place,” one veteran bankruptcy attorney said.

Bankruptcies aren’t just rising — they’re suddenly everywhere.

From billion-dollar giants to mom-and-pop shops to everyday individuals, bankruptcies are piling up across the US this year, with large corporate bankruptcies already hitting their highest level in 15 years.

The surge in bankruptcies highlights the growing financial pressures facing consumers and companies as costs climb amid a tougher borrowing environment….

Personal bankruptcies – In addition to big and small businesses, individual bankruptcies have also increased amid rising costs. Individual bankruptcy filings saw an 8% jump to 40,973 in November 2025, up from the 37,814 filings in November 2024, the data cited by ABI shows.

Full article: https://www.businessinsider.com/bankruptcies-across-economy-small-business-households-corporate-2025-12

__________________________________

Credit Card Interest Rates

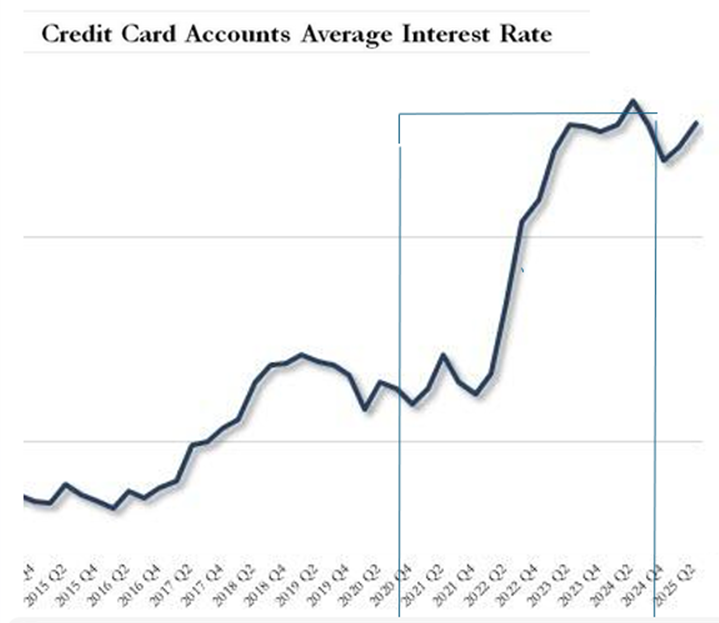
Federal Reserve’s latest consumer credit report (G.19): “Despite the 1.50% in rate cuts since last September, we can now confirm that rates on credit cards have gone… higher, as banks continue to bleed US consumers dry: at the start of 2025 the average rate on credit card accounts was 22.80%… and on Sept 30 the number was higher at 22.83%, just barely below the all time high of 23.37% set one year ago” (ZeroHedge).

______________________________________

States’ Recession Risk

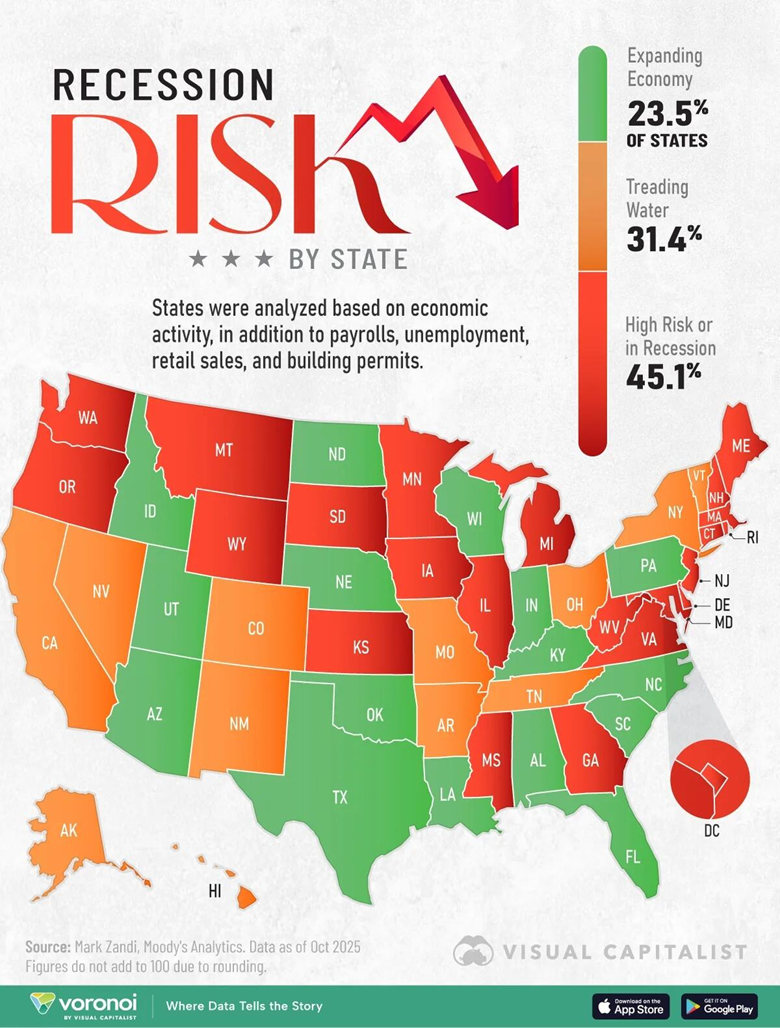
23 US States Are At High Risk Of (Or In) Recession Currently

ZeroHedge, Dec 22, 2025 – Excerpt:

In 2025, states responsible for about a third of U.S. GDP are in recession, or face high recession risk. Another third are expanding, including Florida and Utah, based on payrolls, employment, and other key economic data.

This graphic, via Visual Capitalist’s Dorothy Neufeld, shows recession risk by state in 2025, based on analysis from Mark Zandi, chief economist at Moody’s Analytics.

______________________________

Student Loan Stress

Education Department Has Rejected Over 300,000 Requests For Lower Student Loan Repayments

ZeroHedge, Dec 28, 2025 – Authored by Aaron Gifford via The Epoch Times, – Excerpt:

The U.S. Department of Education has so far denied requests from more than 300,000 existing student loan recipients seeking new repayment terms, according to documents filed in a federal court earlier this month.

The total debt carried by 43 million student loan borrowers currently totals about $1.62 trillion.

……………………..

On the Edge of a “Default Cliff”: New Survey Shows Student Loan Borrowers Are Struggling to Keep Up – Institute for College Access & Success

By Michelle Zampini, Dec 6, 2025 – Excerpt:

Beyond affordability, borrowers report mixed experience with servicers: more than half (61%) of borrowers report having communicated with their servicer to resolve an issue with their account; of those borrowers, three-quarters (75%) said they were able to work with their servicer to resolve the issue. However, nearly half of those borrowers (48%) reported facing long wait times to access help, one quarter (24%) said their servicer provided them with inaccurate information, and one in ten borrowers (11%) believe the balance shown on their account is incorrect.

These findings align with the limited data that ED has released so far this year. At the start of the pandemic pause in March 2020, 8.6 million borrowers were in default. While a portion of those borrowers resolved their default during the pause—either through the “Fresh Start” program or via having their debt discharged—new ED data released in November show that as of October 2025, more than 5.5 million borrowers with over $140 billion in outstanding federal student loans were in default.2 In addition, 1.17 million borrowers were 30-89 days delinquent, 1.56 million were 90-269 days delinquent, and 3.68 million were 270+ days delinquent.

____________________________

The Leviticus 25 Plan impartially grants U.S. citizens the same direct liquidity extensions that were provided to major U.S. and foreign banking concerns during the economic credit crisis of 2008-2010 and the Covid crisis of 2021-2022.

The Leviticus 25 Plan will cleanly and evenly eliminate massive amounts of public and private debt (mortgage debt, consumer debt, student loan debt). It will dramatically and powerfully restore financial security for millions of American families and small businesses.

Large money center banks, rather than receiving ‘hand-out’ liquidity flows direct from the Federal Reserve, will receive massive liquidity infusions that flow from the Fed direct to U.S. citizens, and then on into the banking system through opportunistic debt-elimination.

Excess cash reserves may then be directed by banks into the Treasury market to competitively lower interest rates.

The Leviticus 25 Plan is the most comprehensive, powerful economic acceleration plan anywhere on the planet.

The Leviticus 25 Plan is a dynamic economic initiative providing direct liquidity benefits for American families, while at the same time scaling back the role of government in managing and controlling the affairs of citizens.  It is a comprehensive plan with long-term economic and social benefits for citizens and government.

The inspiration for this plan is based upon Biblical principles set forth in the Book of Leviticus, principles tendering direct economic liberties to the people.

The Leviticus 25 Plan – An Economic Acceleration Plan for America

$95,000 per U.S. citizen – Leviticus 25 Plan 2026 (42435 downloads )

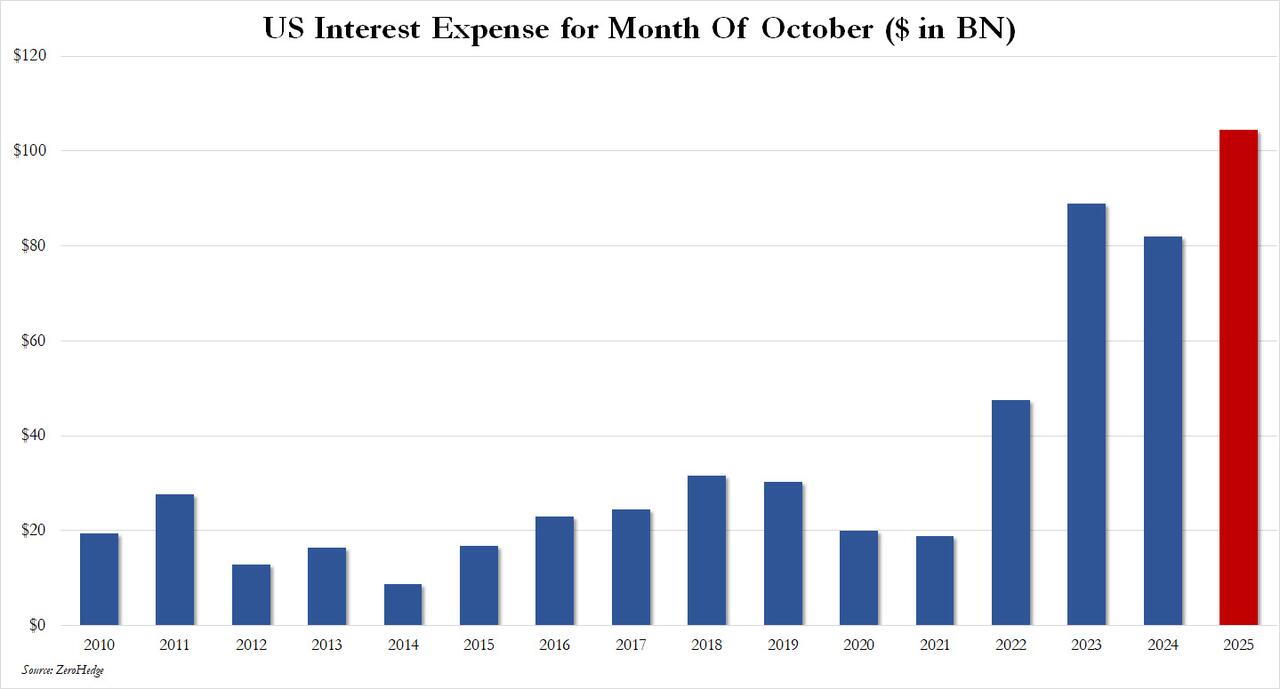
U.S. Starts Fiscal 2025 With $284.4 Billion October Deficit, Gross Interest Expense of $104.4 Billion – Highest on Record

Game Over DOGE: US Starts Fiscal 2025 With Record Budget Deficit, Shocking Interest Expense

ZeroHedge, Nov 25, 2025

Excerpts:

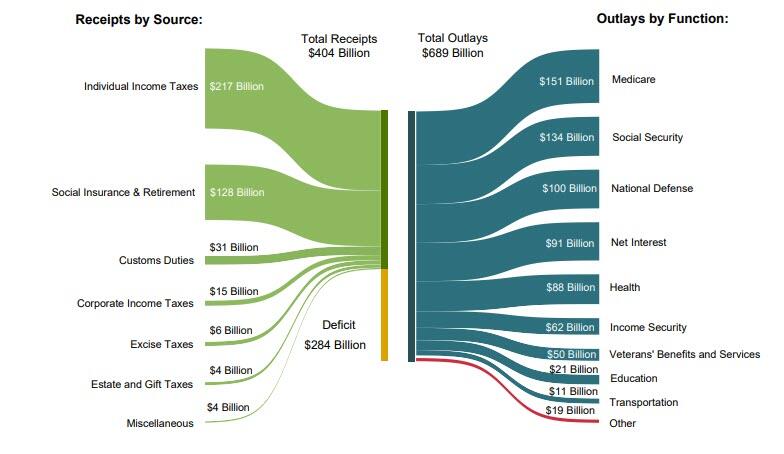
…..Earlier today, the Treasury published the October budget data, and it was ugly. Not all of it, mind you: tax receipts were actually quite solid: at $404 billion, consisting of $217 billion in income taxes and $128 billion in social security receipts…

… government revenues were actually a solid 23.7% improvement to the $326.8 billion collected in October 2024. Of course, that includes the now solid monthly contribution from Trump’s tariffs which in October added $31 billion to the tally.

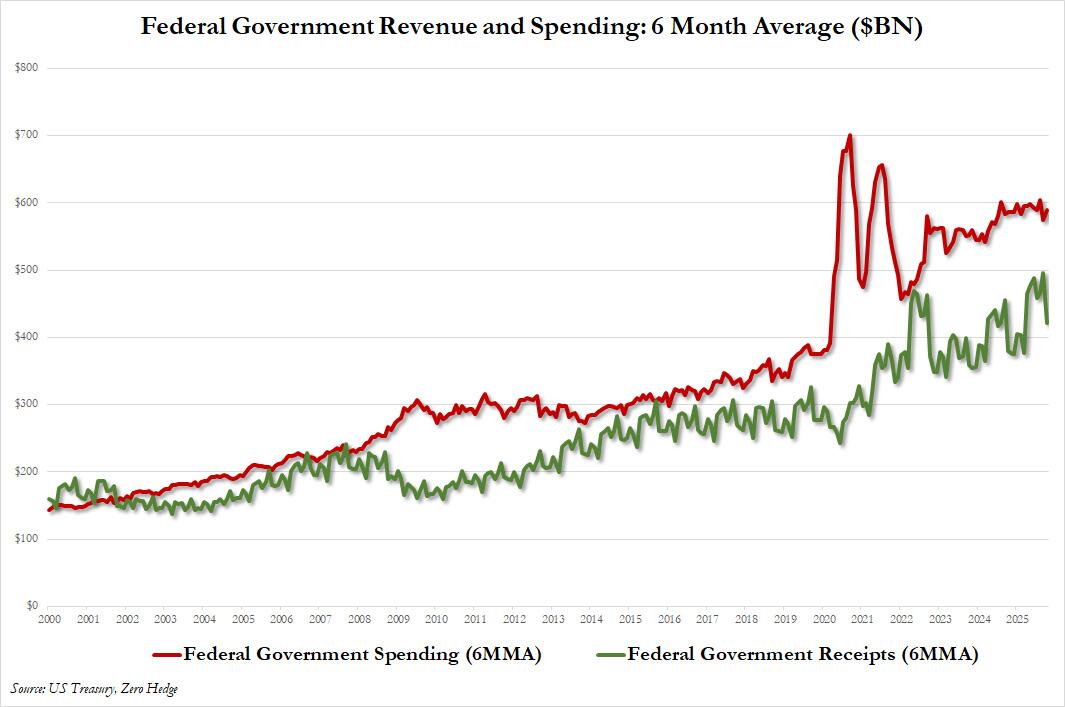
As usual, it was government spending that was the problem again, and at $688.7 billion, or over $22 billion per day, the October total was a 17.9% jump compared to the $584.2 billion spent a year prior. And just when the US was making some modest progress on merging the red (spending) and green (revenue) lines.

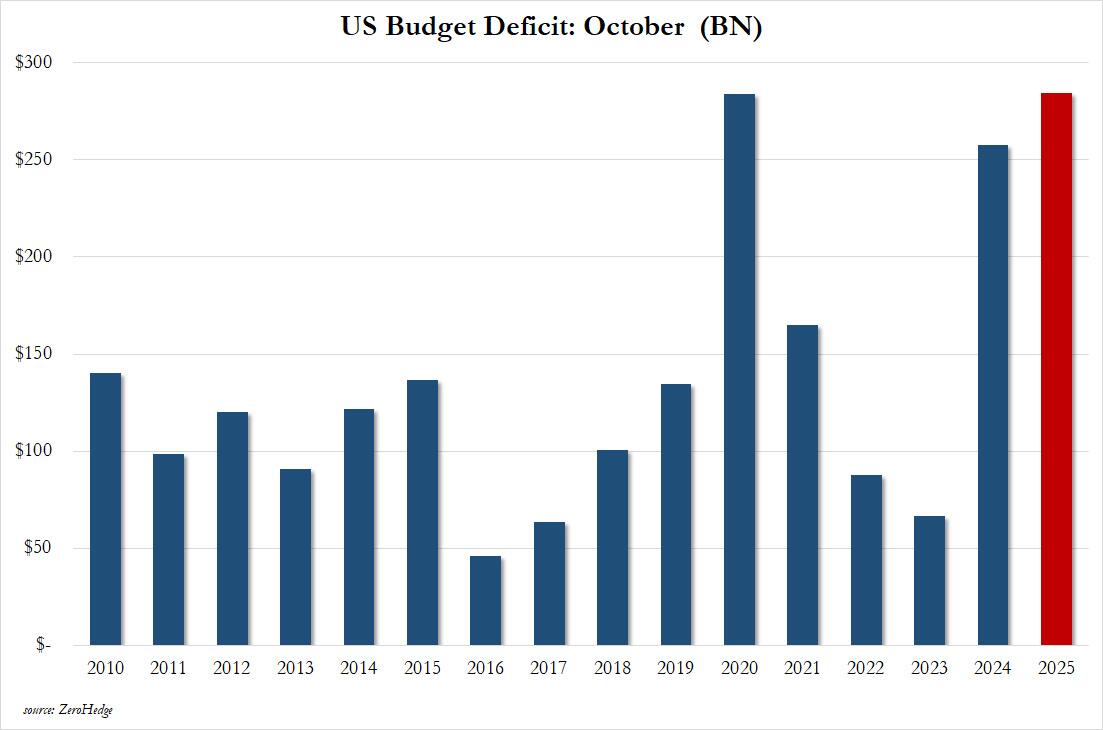
The combination of these two numbers resulted in a $284.4 billion deficit for the month of October, which was not only higher than the $257.5 billion deficit last October, but also higher than the record Covid budget buster of $284.1 billion in October 2020! 

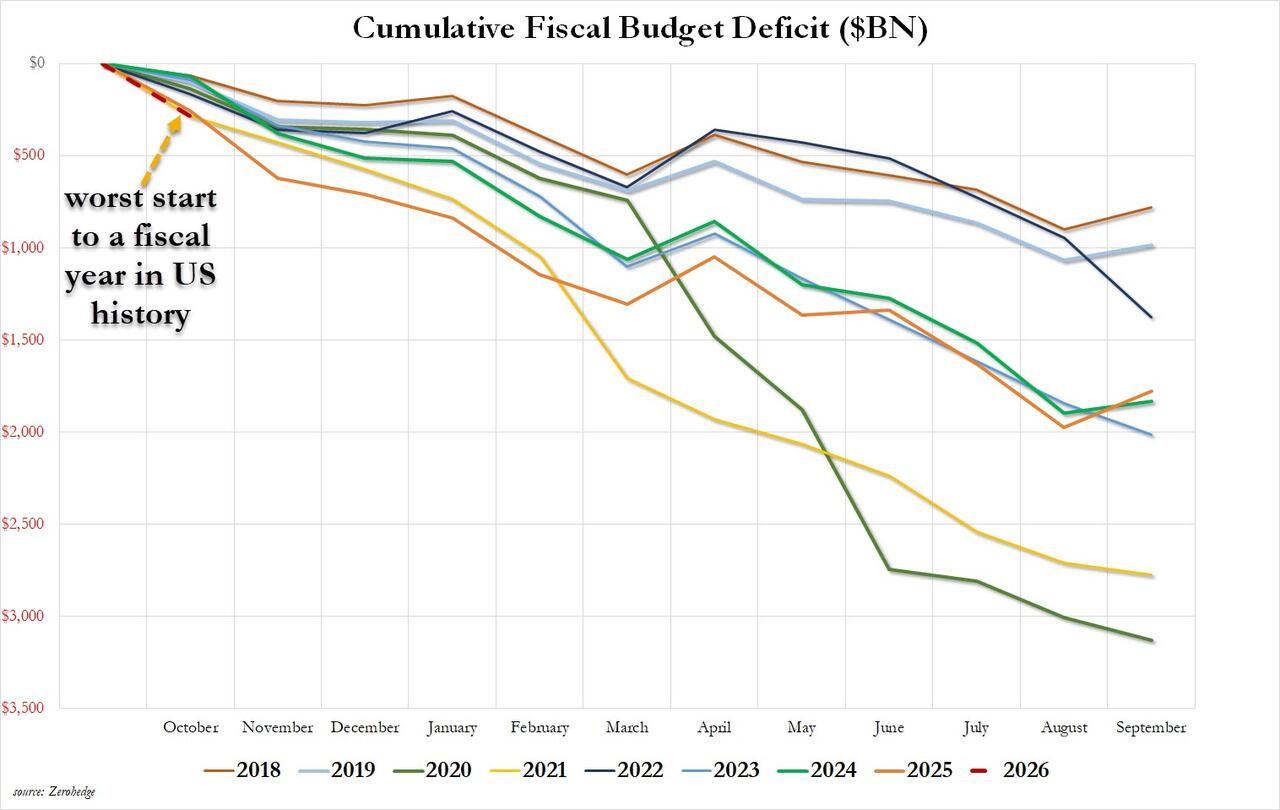
And since we are now (only) one month in fiscal 2026, we now have the worst budget-deficit start to a fiscal year in US history.

In other words, no matter what the official line is, DOGE has left the building. 

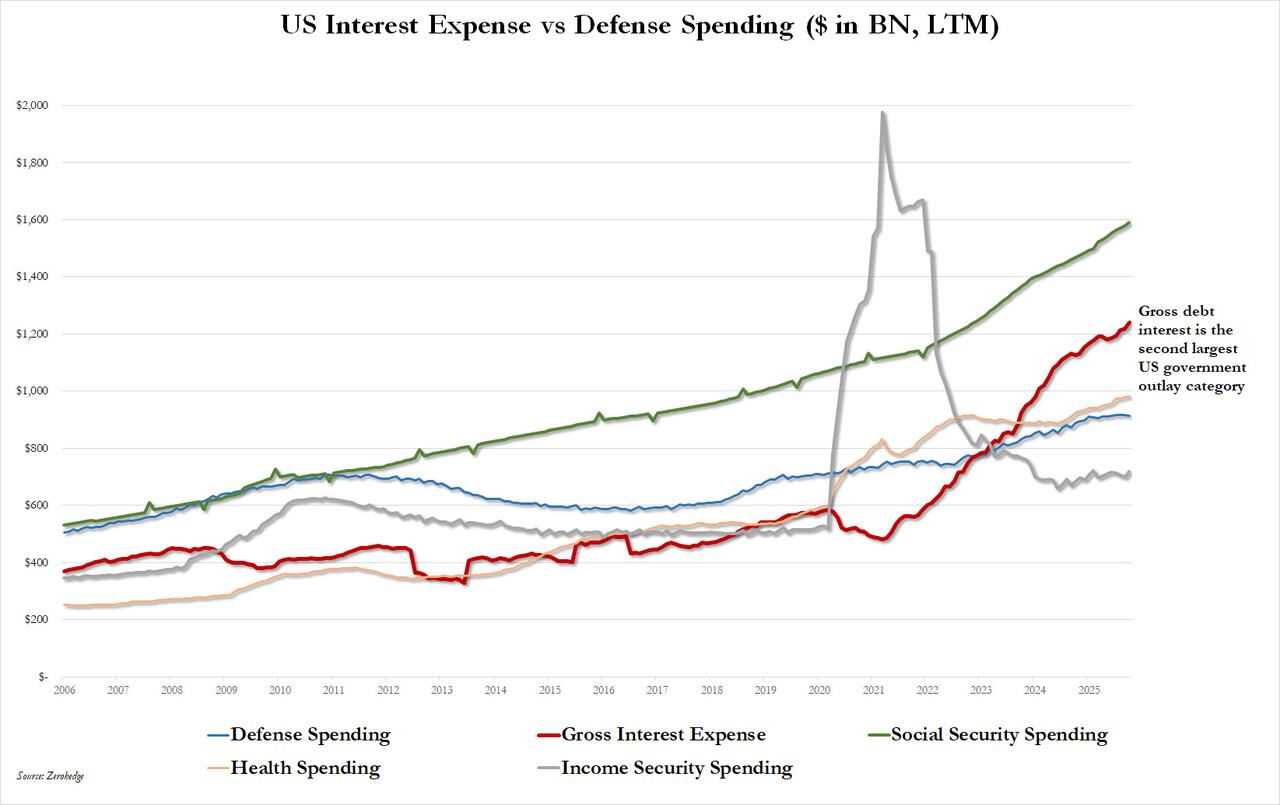
Taking a closer look at the causes of the October budget-busting deficit reveals the same usual suspects: spending across all major categories increased in October, but the most dramatic one was once again the relentless surge in the gross US interest, which is now a record $1.24 trillion in the last twelve months, and is rapidly approaching social security ($1.589 trillion LTM) as the largest source of government spending. 

And here is the punchline: October gross interest was a record $104.4 billion, the highest for the month on record…

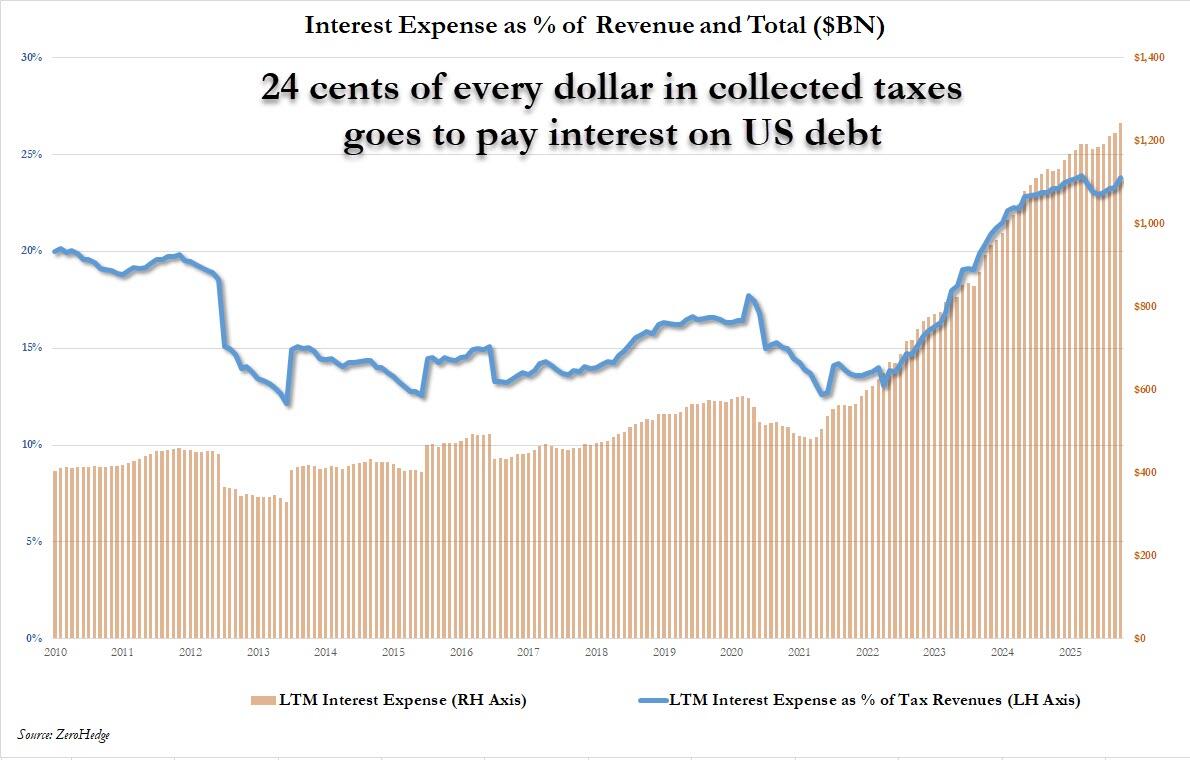
… and at $1.24 trillion in LTM interest expense, it means that 24 cents of every dollar in collected taxes goes to pay interest on the debt. 

Bottom line: after a brief period of irrational hope in early 2025 when Musk’s obsession with DOGE and cutting spending gave the US some hope that there just may some – very painful – way out of this Minsky Moment, we are not only back at square zero one and back on the fast-track to the debt-death of the United States, but the US fiscal picture has never been worse!

No wonder why in a recent public commentary, Musk fully agrees with us: the government is unfixable.

___________________________________________

Mr. Musk is wrong. “Government,” and America’s fiscal failures are indeed “fixable.’

The Leviticus 25 Plan is a dynamic economic initiative providing direct liquidity benefits for American families, while at the same time scaling back the role of government in managing and controlling the affairs of citizens.  It is a comprehensive plan with long-term economic and social benefits for citizens and government.

The inspiration for this plan is based upon Biblical principles set forth in the Book of Leviticus, principles tendering direct economic liberties to the people.

The Leviticus 25 Plan – An Economic Acceleration Plan for America

$95,000 per U.S. citizen – Leviticus 25 Plan 2026 (40947 downloads )

Millions of Americans Living ‘Paycheck to Paycheck’

Nearly 1 in 4 American households living paycheck to paycheck, report reveals

Lower-income families hit hardest as inflation grows faster than wages, Bank of America Institute data shows

By Eric Revell FOXBusiness

Excerpts:

The Bank of America Institute report found that almost 24% of households would be classified as living paycheck to paycheck so far in 2025, an increase of 0.3 percentage points from 2024 – although the growth rate is nearly three times lower than it was a year ago.

It defines living paycheck to paycheck as households spending over 95% of their income on necessities like housing, groceries, gas, utilities, internet plans, public transit and childcare. That leaves them with little or no leftover funds for savings or “nice-to-have” discretionary purchases. 

“Although the number of households living paycheck to paycheck is increasing this year, the pace of growth has slowed significantly,” Joe Wadford, an economist at the Bank of America Institute, told FOX Business. “That’s because it seems like a lot of the financial stress that has been increasing has been concentrated in these lower-income households as these families struggle to keep up with cost increases.”

Inflation has grown faster than middle- and lower-income households’ after-tax wages since January 2025, the Bank of America Institute found. 

That trend has led to the share of lower-income households living paycheck to paycheck rising to 29% this year, from 28.6% last year and 27.1% in 2023. Among middle- and higher-income households, there has been little to no increase in the proportion living paycheck to paycheck.

“For middle- and lower-income households, I think inflation is the primary driver. Especially this year, we’ve seen the gap between wages and expenses continue to widen for lower-income households,” Wadford said….

The report also found that wage growth for lower-income earners has been easing compared to higher-income counterparts since the start of 2025, after it rose faster in 2021-22, before cooling in 2023-24….

____________________________________

The Leviticus 25 Plan will lower the cost of living and relieve financial distress for millions of working, tax-paying American families through wide-ranging debt elimination dynamics and the billions of dollars in monthly savings in interest-related debt servicing obligations.

The Leviticus 25 Plan will grant direct liquidity transfers to qualifying U.S. citizens through a Fed-U.S.Treasury based Citizens Credit Facility – in the same way that it provided direct liquidity transfers to major Wall Street global financial institutions during the great financial crisis (2008-2010) and the Covid Criiss (2021-2022), that included none other than: Morgan Stanley, Citigroup, Bank of America, JP Morgan, Goldman Sachs, State Street, AIG, Merrill Lynch, Royal Bank of Scotland (RBS), Barclays, UBS, Deutsche Bank, BNP Paribas, and others…

The Leviticus 25 Plan is a dynamic economic initiative providing direct liquidity benefits for American families, while at the same time scaling back the role of government in managing and controlling the affairs of citizens.  It is a comprehensive plan with long-term economic and social benefits for citizens and government.

The inspiration for this plan is based upon Biblical principles set forth in the Book of Leviticus, principles tendering direct economic liberties to the people.

The Leviticus 25 Plan – An Economic Acceleration Plan for America

$95,000 per U.S. citizen – Leviticus 25 Plan 2026 (40818 downloads )

WalletHub: American Families “Drowning in Debt.” Main Street America Republicans’ Powerful Solution Loaded Up and Ready to Launch.

The Federal Reserve bailed out Wall Street financial firms (domestic and foreign) during the great financial crisis (2008-2010), to include: Morgan Stanley, Bank of America, Citibank, Goldman Sachs, JP Morgan, Merrill Lynch, AIG, State Street, UBS, BNP Paribas, Barclays, Deutsche Bank, Royal Bank of Scotland, and many others.

The Fed again stepped in to flush many of the same financial institutions with liquidity during the Covid crisis (2021-22).

It is now time to grand U.S. citizens the same direct access to liquidity that was so generously doled out to Wall Street.

It is now time to restore financial order in America: The Leviticus 25 Plan

_________________________________

Americans report strain from so reasing household debt

Total household debt increased to $18.59 trillion in the third quarter of 2025, or $990 billion below the all-time 2008 high of $19.57 trillion.

By Elyse Apel | The Center Square | Published: November 12, 2025

More than half of U.S. households say they’re struggling with debt, according to a new WalletHub survey.

Total household debt increased to $18.59 trillion in the third quarter of 2025, which is $990 billion below the all-time 2008 high of $19.57 trillion.

Still, debt is steadily rising for many, with more than two in five people expecting their household debt to increase in the next 12 months.

Chip Lupo, a writer and analyst for WalletHub, told The Center Square in an exclusive interview that the survey’s findings are very concerning.

“What stood out most to me about this survey is just how deeply Americans feel the weight of debt; not just financially, but emotionally and physically,” Lupo said. “More than half of households report struggling with debt; 36% feel ‘owned’ by credit card companies; and 38% say it affects their health. This combination of financial strain and personal stress is striking.”

The recently-released survey was done in conjunction with WalletHub’s Household Debt Report, which examined the latest economic data from the third quarter. Notably, the report found that the average American household had:

• $108,425 in mortgage debt

• $3,500 in home equity lines of credit debt

• $13,727 in auto loan debt

• $13,711 in student loan debt

• $10,227 in credit card debt

• $4,562 in other debt, which included personal loans and other financing

The survey sought to put these findings from the report in context. Across the nation, it found that American families are drowning in debt.

In total, 56% said their household is struggling with debt. Many don’t see an end in sight, with 46% anticipating they will still have debt when they die.

Credit card debt is causing the most strain for families, the survey found. In total, 46% of American households reported struggling with credit card debt the most, followed by mortgages at 23% and student loans at 13%.

Many pointed to high inflation and an ever-increasing cost of living as playing a role in their increasing debt.

“High inflation is seen as the primary driver of rising debt, and nearly half of Americans expect to carry debt to the grave,” Lupo said. “These figures highlight how critical it is for consumers to track their net worth and actively manage debt, especially credit card balances, as the survey shows that this is the most common source of financial stress.”

…………………………………………………………….

Where US Families Are Most Strained By Debt

ZeroHedge, Nov 01, 2025

Excerpt:

Americans are always worrying about debt: their own and their government’s.

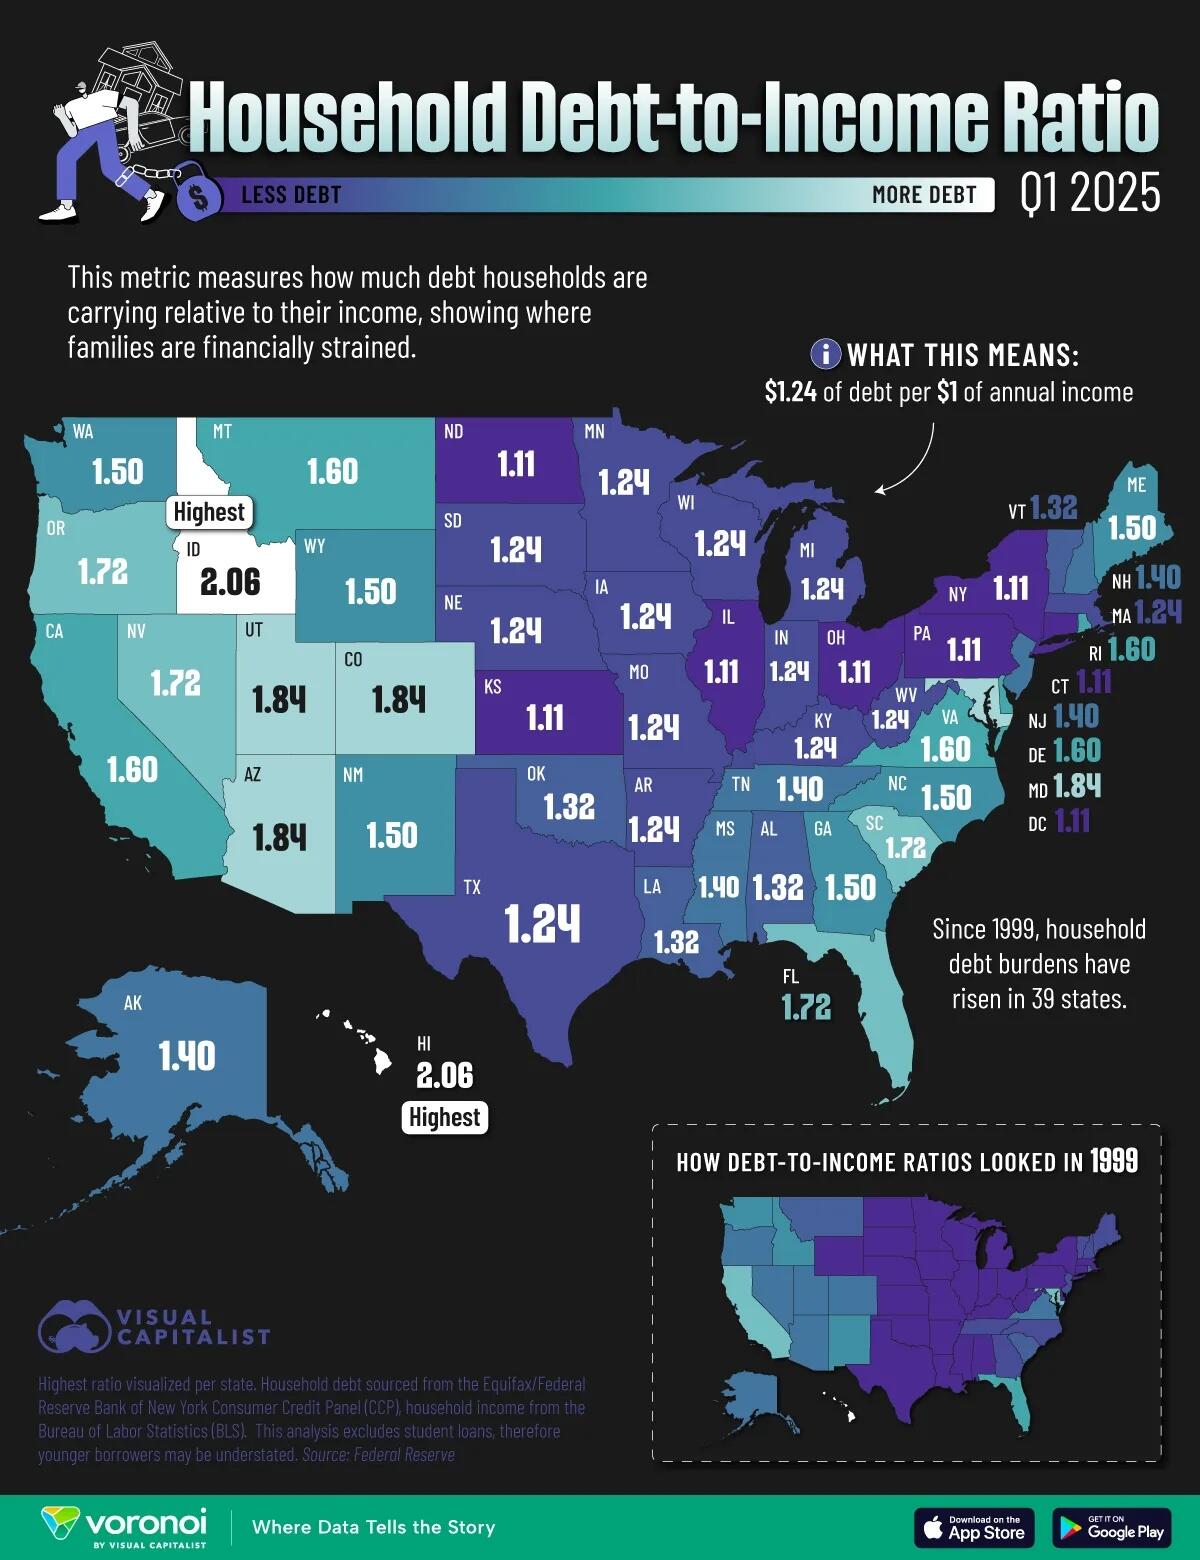
This visualization, via Visual Capitalist’s Pallavi Rao, maps each state by their household debt-to-income ratios (DTI) in Q1, 2025, revealing which states carry the heaviest burdens and which ones keep borrowing in check.

Data for this visualization comes from the Federal Reserve. The highest ratio is visualized per state.

ℹ️ Debt includes mortgages, autos, credit cards, etc., and excludes student loans. Income is based on unemployment insurance-covered wages, as reported to the Bureau of Labor Statistics.

Which States Carry the Most Debt?

Two states share the top spot: Idaho and Hawaii both post a DTI of 2.06, meaning households owe just over twice their annual after-tax income.

RankStateState CodeDebt-to-Income Ratio (2025)Debt-to-Income Ratio (1999)1999–2025 Change
1IdahoID2.061.500.56
2HawaiiHI2.062.060.00
3ArizonaAZ1.841.400.44
4ColoradoCO1.841.400.44
5UtahUT1.841.400.44
6MarylandMD1.841.720.12
7South CarolinaSC1.721.320.40
8NevadaNV1.721.400.32
9OregonOR1.721.400.32
10FloridaFL1.721.600.12
11DelawareDE1.601.110.49
12MontanaMT1.601.320.28
13Rhode IslandRI1.601.320.28
14VirginiaVA1.601.400.20
15CaliforniaCA1.601.72-0.12
16WyomingWY1.501.110.39
17GeorgiaGA1.501.240.26
18MaineME1.501.240.26
19North CarolinaNC1.501.240.26
20New MexicoNM1.501.500.00
21WashingtonWA1.501.500.00
22MississippiMS1.401.110.29
23New HampshireNH1.401.240.16
24New JerseyNJ1.401.240.16
25TennesseeTN1.401.240.16
26AlaskaAK1.401.320.08
27AlabamaAL1.321.110.21
28LouisianaLA1.321.110.21
29OklahomaOK1.321.110.21
30VermontVT1.321.240.08
31ArkansasAR1.241.110.13
32IndianaIN1.241.110.13
33IowaIA1.241.110.13
34KentuckyKY1.241.110.13
35MassachusettsMA1.241.110.13
36MichiganMI1.241.110.13
37MinnesotaMN1.241.110.13
38MissouriMO1.241.110.13
39NebraskaNE1.241.110.13
40South DakotaSD1.241.110.13
41TexasTX1.241.110.13
42West VirginiaWV1.241.110.13
43WisconsinWI1.241.110.13
44ConnecticutCT1.111.110.00
45District of ColumbiaDC1.111.110.00
46IllinoisIL1.111.110.00
47KansasKS1.111.110.00
48New YorkNY1.111.110.00
49North DakotaND1.111.110.00
50OhioOH1.111.110.00
51PennsylvaniaPA1.111.110.00

…check out Visualizing Government Debt-to-GDP Around the World on Voronoi, the new app from Visual Capitalist.

___________________________________________

The Leviticus 25 Plan is the one and only comprehensive economic acceleration plan in the world with the raw power to eliminate massive tracts of family debt and restore self-reliance and financial security for millions of qualifying American families.

It is also the only plan that can restore financial order within the U.S. federal government and the state governments of all 51 states.

The Leviticus 25 Plan will also generate an average $36.568 billion in federal budget surpluses over each of the first five years of activation (2026-2030) – versus projected $2 trillion deficits.

The Leviticus 25 Plan – An Economic Acceleration Plan for America

$95,000 per U.S. citizen – Leviticus 25 Plan 2026 (40186 downloads )

Food Stamp (SNAP) Clean Up Time – Lifting People Up Out of Poverty the Right Way, and Saving America Billions…

The Leviticus 25 Plan would lift millions of working-class, tax-paying American families up out of poverty – and eliminate the ever-growing dilemma of food lines and dependence upon government-based food handouts.

……………………………………………

Food Stamps To Be Paused For 42 Million Americans: What To Know…

ZeroHedge, Oct 29, 2025 – Excerpts:

Food stamps are set to be paused on Nov. 1 because of the government shutdown.

Some 42 million Americans will not receive benefits through the Supplemental Nutrition Assistance Program (SNAP) until Congress approves new funding, according to federal officials, although some states have taken steps to intervene.

As Ryan McMaken details below, via The Mises Institute, according to the Treasury Department’s report on federal spending for fiscal year 2025, total spending on food stamps—also known as the Supplemental Nutrition Assistance Program (SNAP)—was $106 billion for the twelve-month period ending September 30.

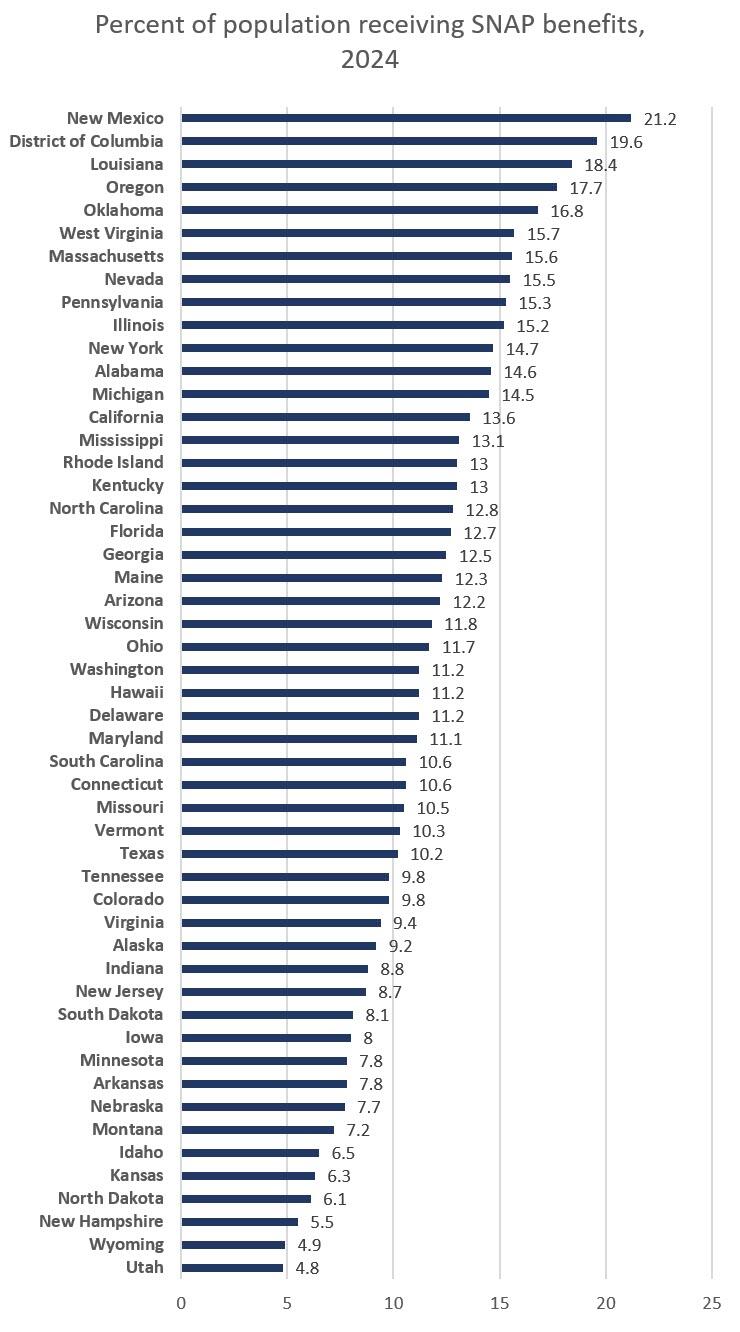
Nationwide, the total percentage of the population receiving food stamps can vary significantly by state, and region. Measured state-by-state, we find that more than one in five residents of New Mexico receive food stamps. In Utah, on the other hand, fewer than one in twenty receive food stamps. 

………………………………………………………………..…………………

Mercatus Center | George Mason University | May 13, 2025

Reducing Waste and Fraud in SNAP

Why SNAP fraud persists—and how to stop it

By Keith Hall
Excerpts:

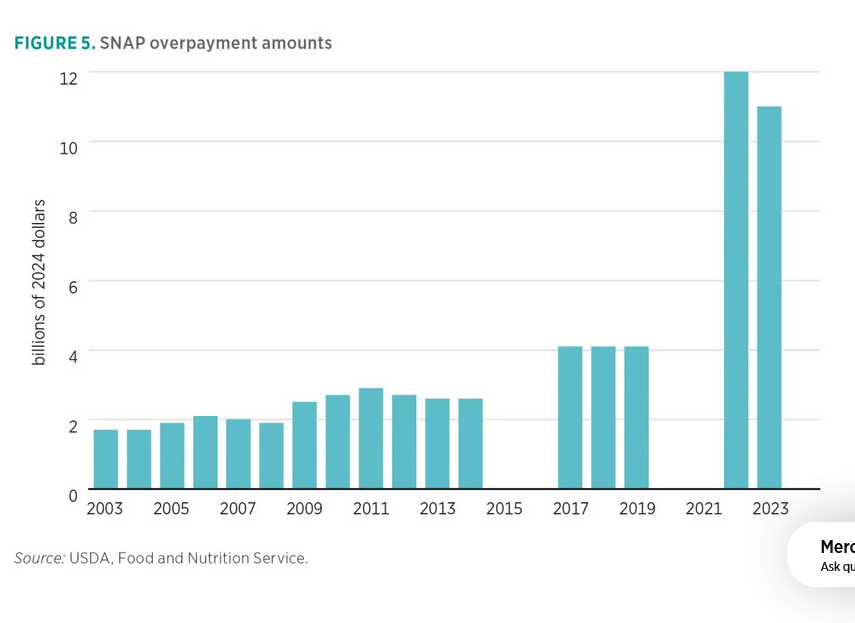
By 2023, the pandemic had pushed the national SNAP program error rate to nearly 12 percent, with overpayments amounting to about 10 percent of that figure. At the state level, overpayment rates were as high as 57 percent for Alaska. Even before the increase in the pandemic-era rates, the national overpayment rate had been rising rapidly: While it was just a little over 2 percent in 2012, the national overpayment rate hit 6 percent in 2019, before the pandemic. In dollar terms, as of December 2024, SNAP overpayments are up to $10 billion per year, and much of this amount is from benefit trafficking, which now costs $1.3 billion annually.

Nonbenefit costs to the federal government

In addition to contributing to state administrative expenses, the federal government covers other, nonbenefit costs associated with SNAP. First, the FNS reviews the states’ administration of the program in accordance with federal requirements. The federal government also supports state expenses for nutrition education programs, employment and training programs, benefit and retailer redemption and monitoring, payment accuracy, electronic benefits transfer (EBT) systems, program evaluation and modernization, program access, and health and nutrition pilot projects.

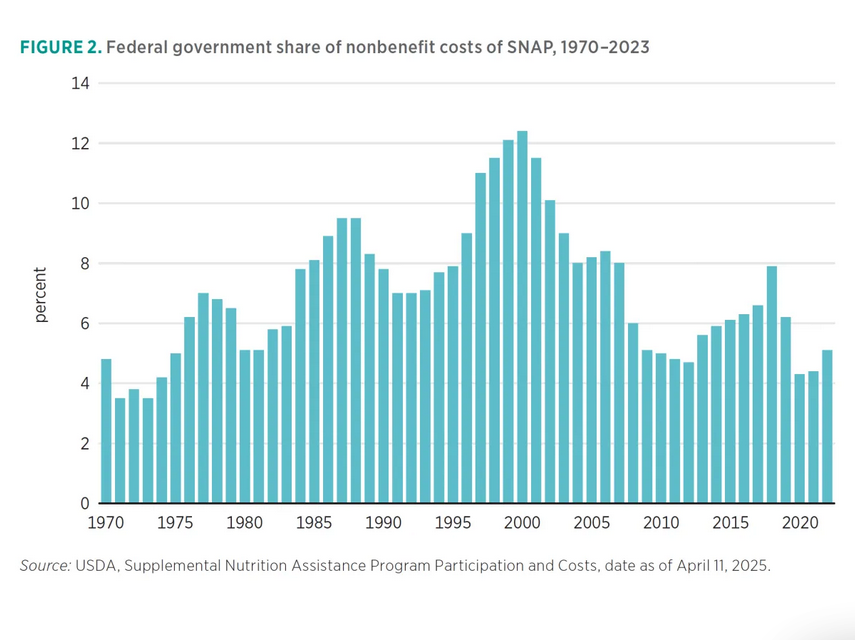
The share of total federal spending on nonbenefit costs was about $6 billion in FY 2023, or 5 percent of the total costs (see figure 2).[3] SNAP administrative expenses vary quite widely by state.[4] For example, in FY 2016 average administrative expenses varied from $89 per case in Florida to $848 per case in Wyoming. However, there is little understanding of these differences, as this variation does not seem to be explained by economic conditions or caseload levels.

Overpayments have always dominated the program error rate. In 2023, for example, they outpaced underpayments six to one… in FY2023, SNAP overpayments totaled $10.7 billion, but recovery of overpayments was just $389 million, or less than 4 percent.[13]

Despite increased efforts to curtail waste, there has been no evidence of anything but increases in overpayments since FY 2013. Furthermore, there is no comprehensive measure of fraud in the program, but taxpayer dollars are lost whether overpayments are fraudulent or just errors. Because of the high cost of the program, these overpayment rates have certainly cost the government tens of billions of dollars (see figure 5).

SNAP Fraud
Trafficking of SNAP benefits
Problems specifically related to the use of EBT cards
Retailer application fraud
Errors and fraud by households
Errors and fraud by state agencies

__________________________________________

The vast majority of federal and state entitlement programs, SNAP and TANF in particular, are rife with waste and fraud.

There is one comprehensive economic plan in America with the raw power to wipe out hundreds of billions of dollars in these annual losses – while at the same time lifting millions of U.S. citizens up out of the ranks of poverty.

The Leviticus 25 Plan is a dynamic economic initiative providing direct liquidity benefits for American families, while at the same time scaling back the role of government in managing and controlling the affairs of citizens.  It is a comprehensive plan with long-term economic and social benefits for citizens and government.

The inspiration for this plan is based upon Biblical principles set forth in the Book of Leviticus, principles tendering direct economic liberties to the people.

The Leviticus 25 Plan – An Economic Acceleration Plan for America

$95,000 per U.S. citizen – Leviticus 25 Plan 2026 (38545 downloads )

Keenan: “The Hidden Architecture of Debt” – How Private Banks Captured the Global Economy.

There is one dynamic blueprint to rebalance the U.S. economy in favor ‘non-debt based’ money creation: The Leviticus 25 Plan.

…………………………………

The Hidden Architecture Of Debt: How Private Banks Captured The Global Economy

ZeroHedge, Oct 27, 2025 – Authored by Mark Keenan via RealityBooks.com,

Select Excerpts:

Introduction: Why Money Power Matters

A century of central banking and commercial credit has normalized a simple but profound fact: most new money is created when banks make loans. As former U.S. Treasury Secretary Robert B. Anderson put it in 1959, when a bank issues a loan, it credits a deposit that did not exist the moment before; the new deposit is “new money.” In practice, this means the money supply expands primarily through private lending, not public issuance.

That mechanism is turbocharged by fractional-reserve banking and today by capital-based banking rules: banks do not lend out pre-existing savings one-for-one; they expand deposits by creating credit. Interest is attached to that credit, meaning the system requires continual new borrowing to service past borrowing. If credit creation slows materially, defaults rise, asset prices wobble, and political pressure mounts to “stimulate” again. In short, we live inside a treadmill that is far more credit-driven than most civics textbooks admit.

…………………………..

Modern banking’s political leverage grew alongside institutions like the Bank of England and, later, the U.S. Federal Reserve (established in 1913). Whatever the intention of their founders, central banks now sit at the junction of state and finance: they are publicly mandated yet operationally insulated (and privately owned), coordinating liquidity to stabilize the system while commercial banks originate most money-like claims.

This hybrid design has real consequences. It allows a small circle of decision-makers to set the price of money (interest rates), backstop private balance sheets in crises, and influence fiscal choices by making some policies financially easy and others expensive. Former Fed Chair Alan Greenspan once emphasized the institution’s independence; the flip side of that independence is low democratic visibility over choices that shape every mortgage, job market, and public budget.

Beyond national central banks lies the Bank for International Settlements (BIS) in Basel — often called the “central bank of central banks.” Through standards (Basel accords) and coordination, it helps align global banking rules. Critics argue this produces a technocratic layer of control over national economies with little public oversight. Whether one views that as prudent stewardship or as democratic deficit, it underscores a theme: the architecture of money governance is largely opaque to the public it governs.

……………………..

Critics like Roy Madron, John Jopling, and John Scales Avery have argued that this growth-dependency crowds out other goals: equitable distribution, environmental stewardship, and cultural stability. It also explains why mainstream debates often avoid the root structure and instead focus on the speed of the treadmill…

………………….

When money is predominantly debt, interest is not a side note; it is a structural tax on all who need money to transact. Banks, by creating credit, collect streams of interest that compound through the system. Meanwhile, inflation — the dilution of purchasing power — often becomes a necessary byproduct of keeping debt-loads serviceable. In practice, inflation acts as a stealth transfer from savers and wage earners to those closer to the spigot of new money (large financial institutions and asset owners).

This is not an argument to abolish credit; modern economies need flexible financing. It is an argument to name the trade-offs honestly. When we call monetary loosening a “stimulus,” we should also disclose who absorbs the loss in purchasing power and who gains from asset inflation. When we raise rates to “fight inflation,” we should admit the cost in jobs, bankruptcies, and public budgets. Stability is never free; it is reallocated volatility.

…………………..

Beyond national systems lies a web of global coordination — standards, swap lines, and lender-of-last-resort arrangements that knit economies together. Institutions such as the BIS, the IMF, and development banks shape the terms of liquidity and restructuring. Supporters say this is necessary to prevent contagion; critics counter that it allows a transnational financial class to set conditions on democratic societies in moments of maximum vulnerability.

Both views can be true. But whichever side you take, the outcome is similar: creditors hold leverage, and policy follows balance-sheet realities. The deeper the debt and the tighter the markets, the narrower the options for governments and citizens. This is not a conspiracy; it is a design choice we rarely discuss.

………………

Conclusion: Seeing the Machine

If you remember only one thing, let it be this: money is not neutral. How it is created, who controls its issuance, and what claims attach to it determine the shape of our economies and the boundaries of our politics. We can disagree about the best reforms, but we can no longer afford civic illiteracy about the monetary plumbing that governs our lives.

In a healthy society, the architecture of money would be a public conversation, not a specialist’s secret. Until then, the treadmill will keep turning — and those closest to the controls will keep deciding how fast the rest of us must run.

Full article: https://www.zerohedge.com/geopolitical/hidden-architecture-debt-how-private-banks-captured-global-economy

*  *  *

Mark Keenan is a former United Nations technical expert and the author of The Debt Machine: How Private Banks Engineered Global Control and Climate CO₂ Hoax: How Bankers Hijacked the Environment Movement. His work examines how global finance and policy networks shape the modern world behind the scenes.

______________________________________

The Leviticus 25 Plan corrects the imbalances in America’s debt-based money creation by granting millions of hard-working, tax-paying U.S. citizens the same direct liquidity extensions that were so generously provided to major U.S. and foreign banking concerns during the 2008-2010 great financial crisis, and again during the 2021-2023 Covid crisis.

The Leviticus 25 Plan – An Economic Acceleration Plan for America

$95,000 per U.S. citizen – Leviticus 25 Plan 2026 (38442 downloads )

BIG Government and the Sovereign Debt Crisis

“Big government means low growth, high taxes, weak real wages, and a persistent productivity drag..”

Solution: There is one economic plan with the raw firepower to reignite economic growth, reduce taxes, generate ‘real wage gains,’ and spur productivity — The Leviticus 25 Plan

………………………………………………………

The “Triumph Of Big Government” Created The Current Sovereign Debt Crisis

ZeroHedge, Oct 22, 2025 – Authored by Daniel Lacalle,

Excerpts:

A few years ago, The Economist published an issue called “The Triumph of Big Government,” highlighting the rise of government intervention as the main driver of economic recovery and growth. The years of budget and deficit control were over. Mainstream economists hailed the decisive action of governments in developed nations, committed to spending to boost growth and abandoning the old “austerity” principles.

Only a few years later, The Economist publishes an issue titled “The Coming Debt Emergency,” mentioning the enormous deficit and debt problems in France, the United Kingdom, Japan, and the United States.

What happened? How can long-term bond yields rise when central banks are cutting rates? How did government debt lose its place as a reserve asset? Easy. Developed economies’ governments of all colours, from Biden and Sunak to Macron and Ishiba, bought the MMT fallacy that “deficits do not matter” and “sovereign nations can issue all the debt they need without risk.” Virtually all international bodies hailed statism as the global solution. However, in 2022, global central banks and investors started abandoning sovereign debt as a reserve asset and decided to add gold.

Developed nations have surpassed the three limits of indebtedness: the economic, fiscal and inflationary limitations. When more public debt creates lower economic and productivity growth, the economic limit has been surpassed. When interest expenses and deficits continue to rise despite rate cuts and higher taxes, the fiscal limit collapses. Additionally, when governments become addicted to issuing more debt in any part of the cycle, with diminishing investor demand, inflation becomes persistent.

No one really believes developed nations’ governments will control their public finances, and constant tax hikes and excessive regulation have choked the productive economy.

Employment is showing the negative effect of the “triumph of big government”. Bloating government spending may disguise GDP but does not create jobs.

Even as government spending continues to artificially elevate headline GDP figures, global labour markets are showing weakness. According to S&P Global’s October 2025 PMI Bulletin, the global economy continues to show headline growth, but employment growth has stalled, and productivity improvement has declined sharply.

S&P Global’s global composite PMI stood at 52.4 in September, its lowest level in three months. Companies are attempting to manage high taxation and regulatory burdens, resulting in stagnant employment levels and output growth. Employment was broadly flat across both manufacturing and services sectors, a sign of declining confidence and cost-saving across advanced economies.

The eurozone is a key example of how big government destroys employment growth, real wage improvements and investment. The modest improvement in activity comes with a decline of hiring and investment. The United Kingdom’s tax hikes and net zero policies have decimated the industry and obliterated employment growth….

Government spending and persistent inflation bloat nominal growth, while real economic productivity and private labour opportunities deteriorate. The erosion of value-added generated by the productive economy is alarming. Considering that major governments are borrowing heavily to fund what they call stimulus measures, and they refuse to reduce current spending, GDP figures are being inflated by debt-financed public sector demand.

This labour market stagnation highlighted by S&P Global coincides with a significant slowdown in real wage growth. Although headline CPI has eased in most advanced economies, real inflationary pressures are elevated and continue to erode disposable income even using official CPI figures. This situation leads to weak real consumption and worsening demographic trends.

Big government means low growth, high taxes, weak real wages, and a persistent productivity drag. Malinvestment and excessive government intervention are now the norm in major economies. SP Global explains that “the most interest rate–sensitive sectors, such as manufacturing and construction, account for a smaller share of economic activity in advanced economies than in the past.” However, the problem is not just interest rates but rising taxes and insurmountable regulations that dampen activity in high multiplier sectors.

The 2030 agenda, along with the so-called green regulations and net zero policies, has resulted in capital misallocation and distortions in policy. Thus, productivity gains are increasingly limited to digital and financial sectors.

Fiscal expansion now drives most of the headline economic activity in developed nations with negative side effects everywhere. The debt service burden is crowding out productive expenditure, high taxes limit investment and hiring, and regulation makes the economy stagnant. As sovereign yields climb, countries like France and the UK are already facing “vicious cycles” of slower growth and higher financing costs.

The reader may think that this is the result of incompetence and malinvestment, and if governments spent wisely and invested in productive activities, all would be fine. No. Central planning never works, even if there are some allegedly beneficial intentions. Keynesianism and social democracy always fail. Why are governments not worried? Because they can raise your taxes and present themselves as the solution.

The solution is simple. Less government means more growth.

___________________________________

Again: “Big government means low growth, high taxes, weak real wages, and a persistent productivity drag..”

“…constant tax hikes and excessive regulation have choked the productive economy.”

“The solution is simple. Less government means more growth.“

………………………………..

And that solution is here – loaded up and ready to launch…

The Leviticus 25 Plan is a dynamic economic initiative providing direct liquidity benefits for American families, while at the same time scaling back the role of government in managing and controlling the affairs of citizens.  It is a comprehensive plan with long-term economic and social benefits for citizens and government.

The inspiration for this plan is based upon Biblical principles set forth in the Book of Leviticus, principles tendering direct economic liberties to the people.

The Leviticus 25 Plan – An Economic Acceleration Plan for America

$95,000 per U.S. citizen – Leviticus 25 Plan 2026 (38218 downloads )

Extreme Poverty Across the U.S. — and the One and Only Economic Plan in America to Lift People Up Out of It.

“No society can surely be flourishing and happy of which by far the greater part of the numbers are poor and miserable.”  – Adam Smith

…………..

Mapping Extreme Poverty Across All American States

ZeroHedge, Monday, Oct 06, 2025 – 06:20 PM

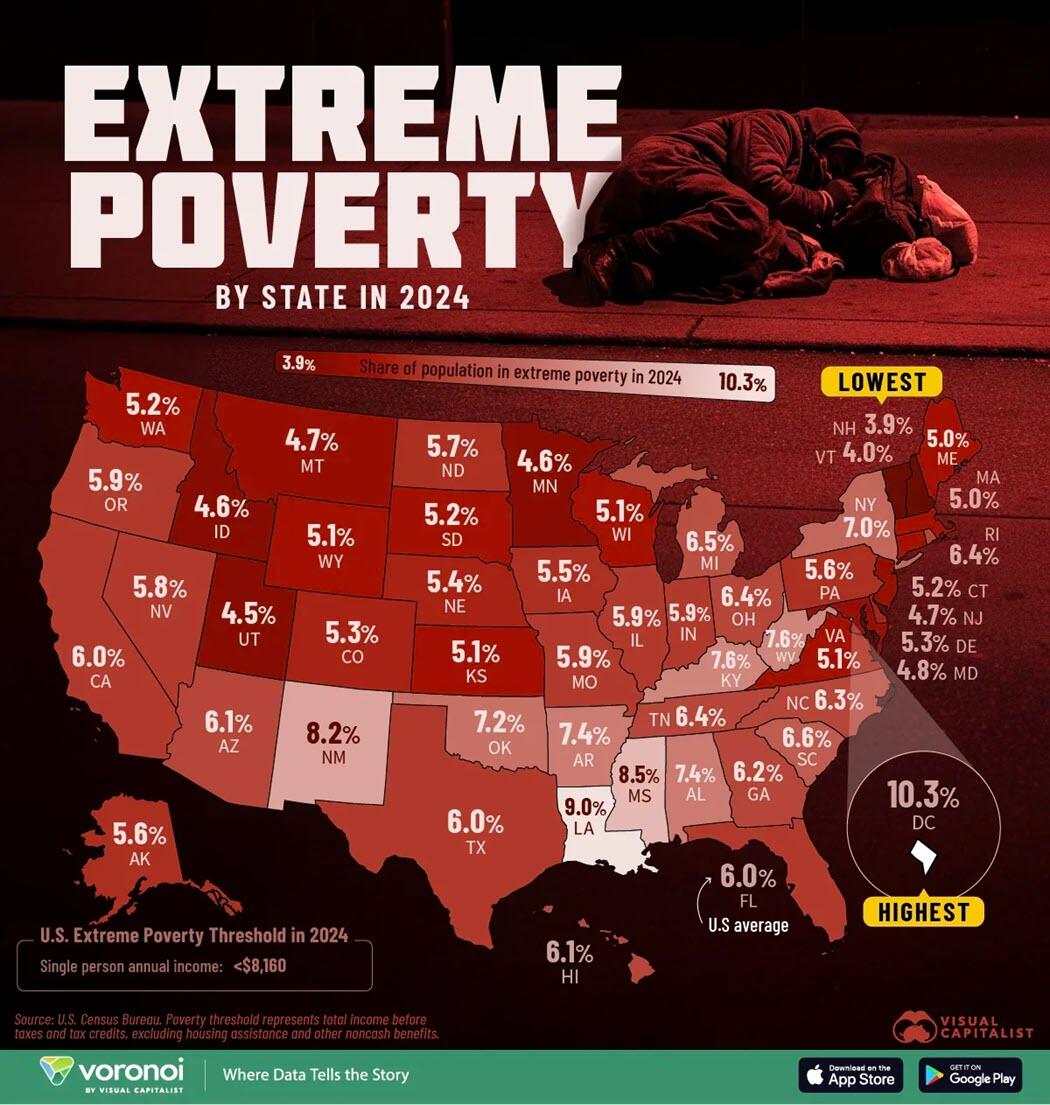
In 2024, 6% of the U.S. population lived in extreme poverty, equal to 20.4 million people.

While there are different definitions of extreme poverty, this is represented as those earning less than $8,160 in annual income, or half of the poverty line. As the federal budget makes cuts to food assistance and healthcare, levels of extreme poverty run the risk of worsening even further.

This graphic, viaVisual Capitalist’s Dorothy Neufeld, shows the share of each state living in extreme poverty in 2024, based on data from the U.S. Census Bureau.

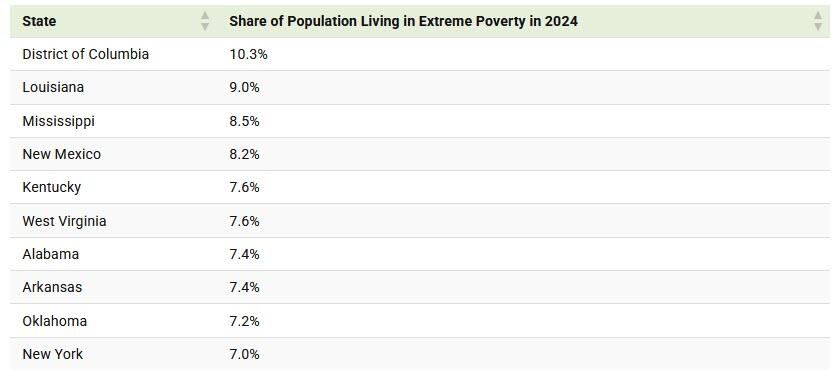
Washington D.C. Has the Highest Level of Extreme Poverty

Last year, more than one in 10 residents of the nation’s capital lived in extreme poverty. 

Going further, economic hardship disproportionately impacts people of color in Washington D.C., with one in three black children living in poverty between 2019 and 2023, on average.

As we can see, Southern states also rank among the most impoverished. In Louisiana, 9% of residents live in extreme poverty, and on average, 18.9% lived below the poverty line between 2021 and 2023.

Meanwhile, 7% of New York’s population are extremely impoverished, equal to an estimated 1.4 million people.

On the other end of the spectrum is New Hampshire with the lowest rate nationally, at 3.9%. The Granite State benefits from a stable job market, low unemployment, and a strong education system. Paired with relatively affordable healthcare, these factors contribute to higher living standards for its residents, reducing the risk of poverty.

___________________________________

The Leviticus 25 Plan is the one plan in America with the raw, irresistible power to lift millions of qualifying U.S. citizens up out of poverty and back on the road to living productive lives.

The Leviticus 25 Plan is a dynamic economic initiative providing direct liquidity benefits for American families, while at the same time scaling back the role of government in managing and controlling the affairs of citizens.  It is a comprehensive plan with long-term economic and social benefits for citizens and government.

The inspiration for this plan is based upon Biblical principles set forth in the Book of Leviticus, principles tendering direct economic liberties to the people.

The Leviticus 25 Plan – An Economic Acceleration Plan for America

$95,000 per U.S. citizen – Leviticus 25 Plan 2026 (37306 downloads )